Trading Strategy - FX Options Implied Moves
'TTD 1-Day FX Risk Ranges' tradingview indicator explained
‘Expected moves’ and ‘Risk ranges’ derived from option prices are a statistically grounded, market-based way to gauge volatile moves, and to set expectations and boundaries for FX price action. This makes them useful in both risk management and trade execution, and having this in our toolbox helps to boost our edge just that little bit further.
That’s why we developed a TradingView indicator to compliment our own range of trading tools. Below, we cover some basic principles to understand how the indicator is constructed, and how we can apply it to various trading scenarios.
‘BASIC’ PRINCIPLES
What is Implied Volatility (IV)?
IV is a reflection of volatility expectations around market risks. The higher the IV, the greater the volatility expected. IV is quoted in annualised terms meaning that if IV is 10%, the market expects the asset or currency pair to move up or down by 10% over the year.
Date-To-Expiry (DTE)
Because IV is an annualised measure, and not all options are 1-year options, DTE is a key component of how we estimate expected moves. For example, a 1 or 3-month option being quoted in annualised terms, needs to be converted into 1 or 3-month terms to estimate how much an fx pair is expected to move within that period. Assuming that a 1-month option's IV is 10%, the market expected move is calculated by: SQRT(1/12)*10% = 2.89%. For a 3-month option it would be SQRT(3/12), and a 1-week option would use SQRT(1/52) – notice the pattern?
At-The-Money (ATM) IV
We typically use ATM IV to estimate the expected move because ATM, simply refers to the option contract whose strike price is closest to the current spot price, and the IV of that option would therefore give us the best estimate of how much volatility the market is pricing in (or 'expects') from 'now'.
Expected Move in Standard Deviations (SD)
The calculated 'expected move' is considered to be 1SD, where 1SD is considered to be a probabilistic estimate of price staying within that expected range 68% of the time, or roughly 2 out of 3 times. A 2SD move would be 2x more than was expected and statistically rare to exceed expectations by that much, i.e. 2SD would be just 5% of the occurrences in a normal distribution, or 1 out of 19 times. That's the gist, and thinking in those terms is helpful to making trading decisions.
THE INDICATOR
Practical Uses
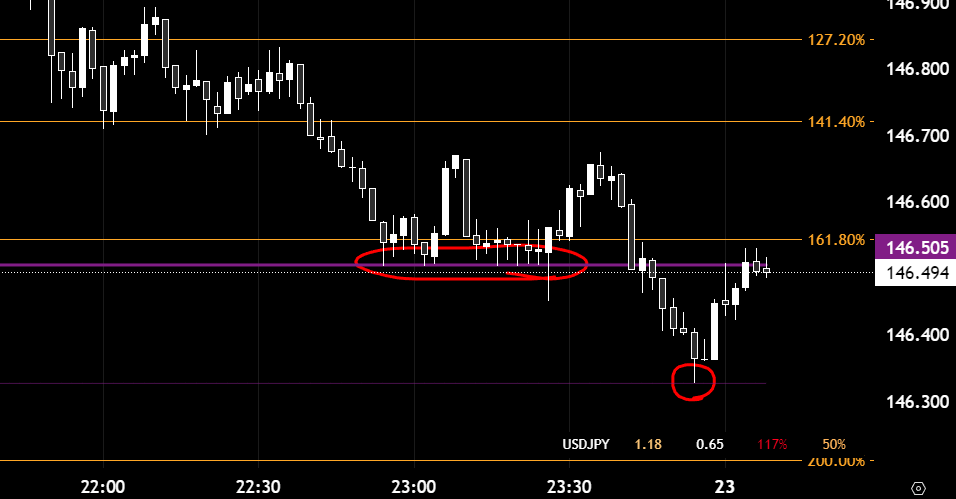
FX is very choppy compared to other asset markets and as result, FX traders are quite often attentive to the level of volatility of various currencies at any one particular time; whether that be about which pairs to keep an eye on, judging the appropriate stop-loss level before or after certain market moves, what levels to set trailing-stops, or levels traders are planning to buy or sell in and out positions. Having a tool such as this provides useful perspective to all those scenarios.
Expected Moves > ATR
Our “1-Day FX Risk Ranges” indicator could be compared to “Average True Range (ATR)”, a very popular indicator among FX traders and both quite similar in terms of their practical usage. But while ATR does provide a reasonable guide to gauging volatility, it is a backward-looking measure (a simple average of historical volatility) whereas options implied risk ranges are forward-looking as it is based on market expectations. That makes our indicator have real practical significance, and arguably the more superior of the two.
Indicator Features
Now that we have a grasp on the basics, the indicator should be fairly straight-forward. It plots the 1SD and 2SD levels on the chart with a table that displays the the high and low of day in SD terms as well as the day's range as a percentage of average daily and weekly range (namely the 21-day ATR and 13-week ATR).
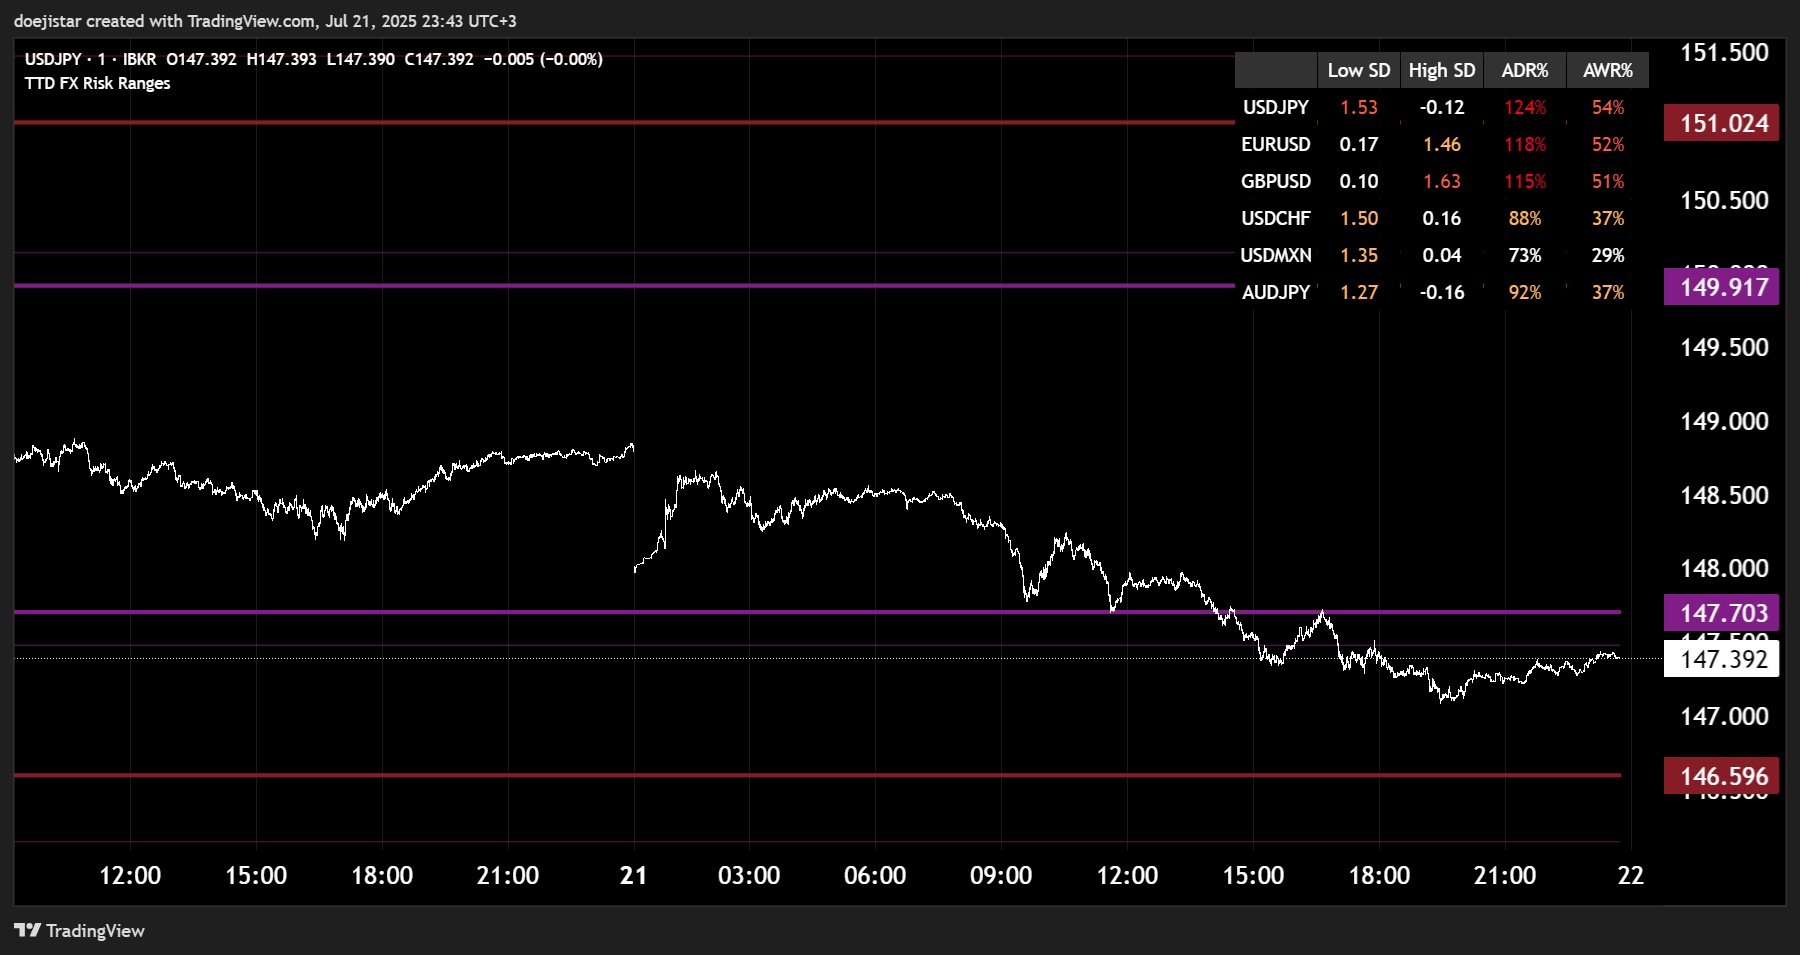
Updating the indicator is straight-forward too. Copy the data from the discord into the indicator settings and the risk levels will be plotted for any of the 24 FX pairs the chart is on. Tradingview does not have FX options data so this needs to be manually done on each new day the indicator is to be used.
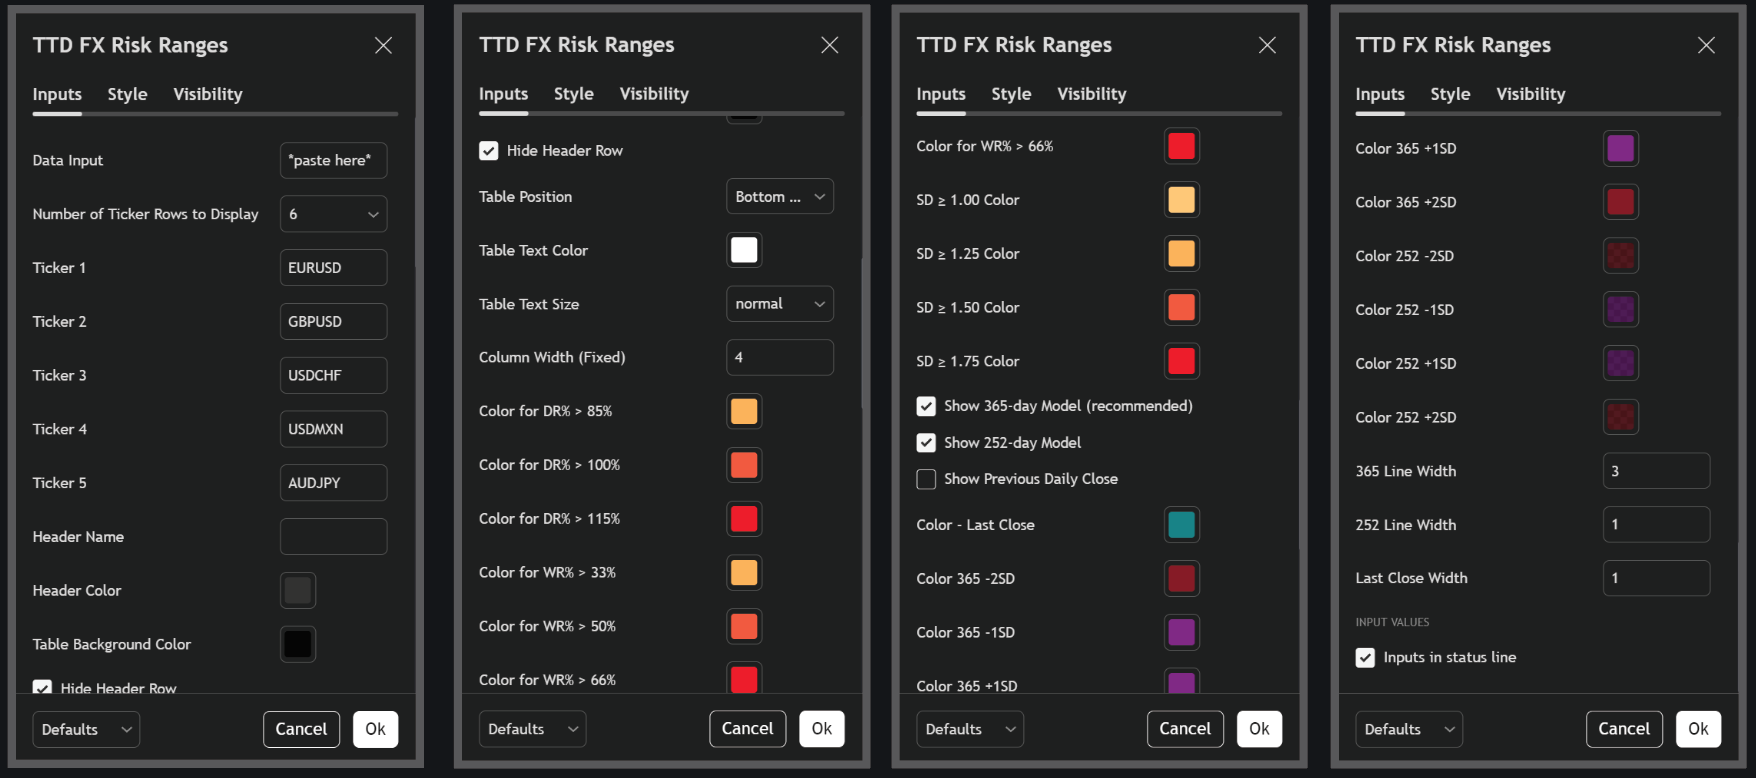
The indicator can be fully customisable to ones own preferences and colour schemes, and should automatically update to reflect any new modifications made to the indicator.
The indicator can be found here 👉 TTD-1-Day-FX-Risk-Ranges.
If you have any questions, you know where to find us. See you in the Dojo!