2025.08.09 Chartstorm
Systematic Hedge funds showing vulnerabilities through equities and US dollar
Systematic Hedge funds showing vulnerabilities through equities and US dollar
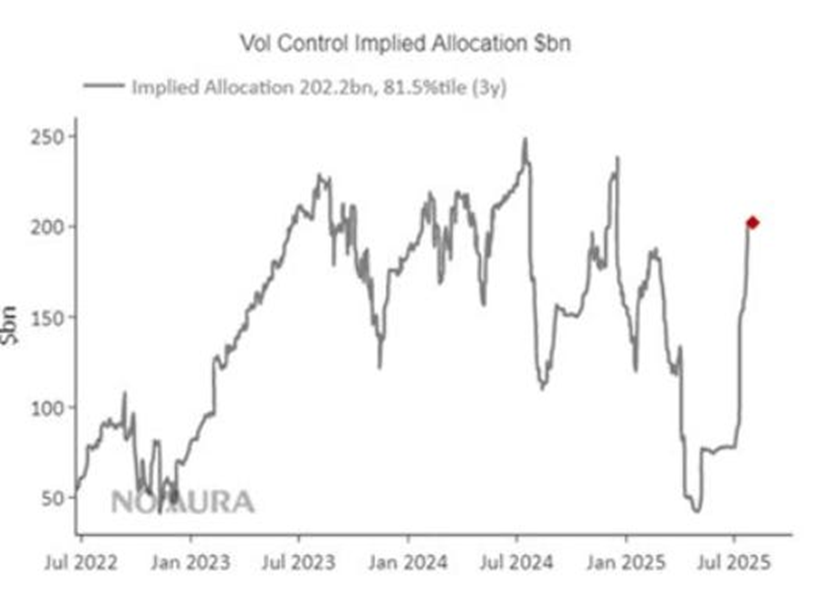
- Nomura: Total allocation of Volatility Control funds to the S&P 500 shows an implied allocation of $202.2bln, the 81.5th percentile over a three-year period.
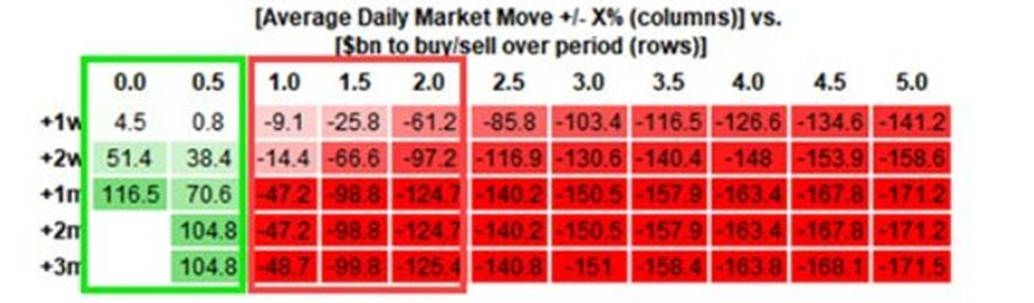
- Nomura: Vol Control funds are buyers if S&P500 trades with an average daily change of less than ±0.50%. Conversely, they are projected to be sellers on all timeframes (1 week, 2 weeks, 1 month, 2 months, 3 months) if S&P 500 averages above ±50bps.
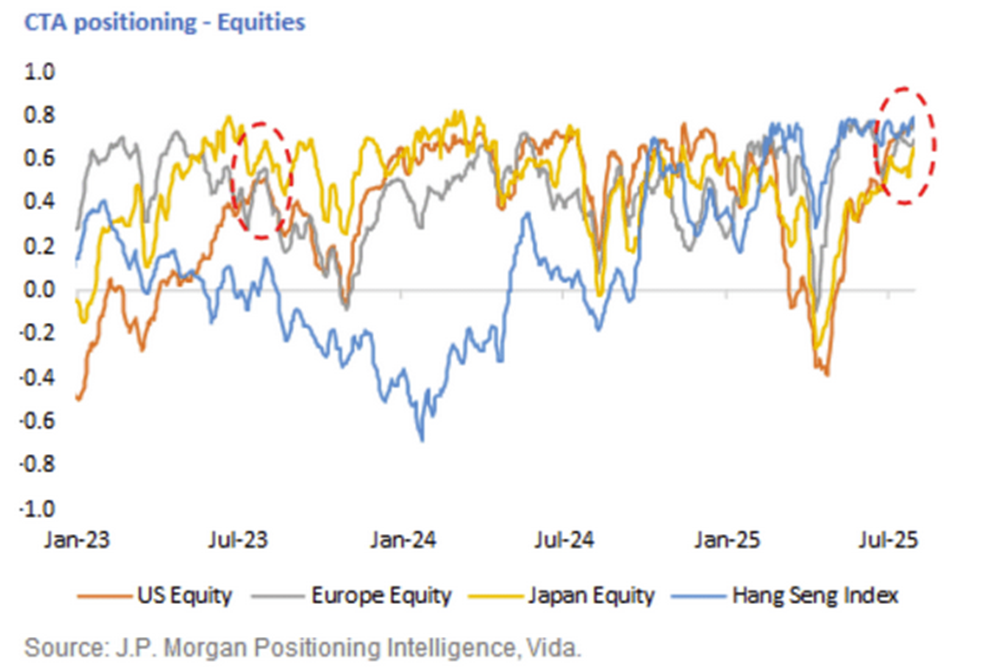
- Commodity Trading Advisors (CTAs) are max long equities across most markets. Their exposure has tripled during the July rally. Yep... tripled over the last month.
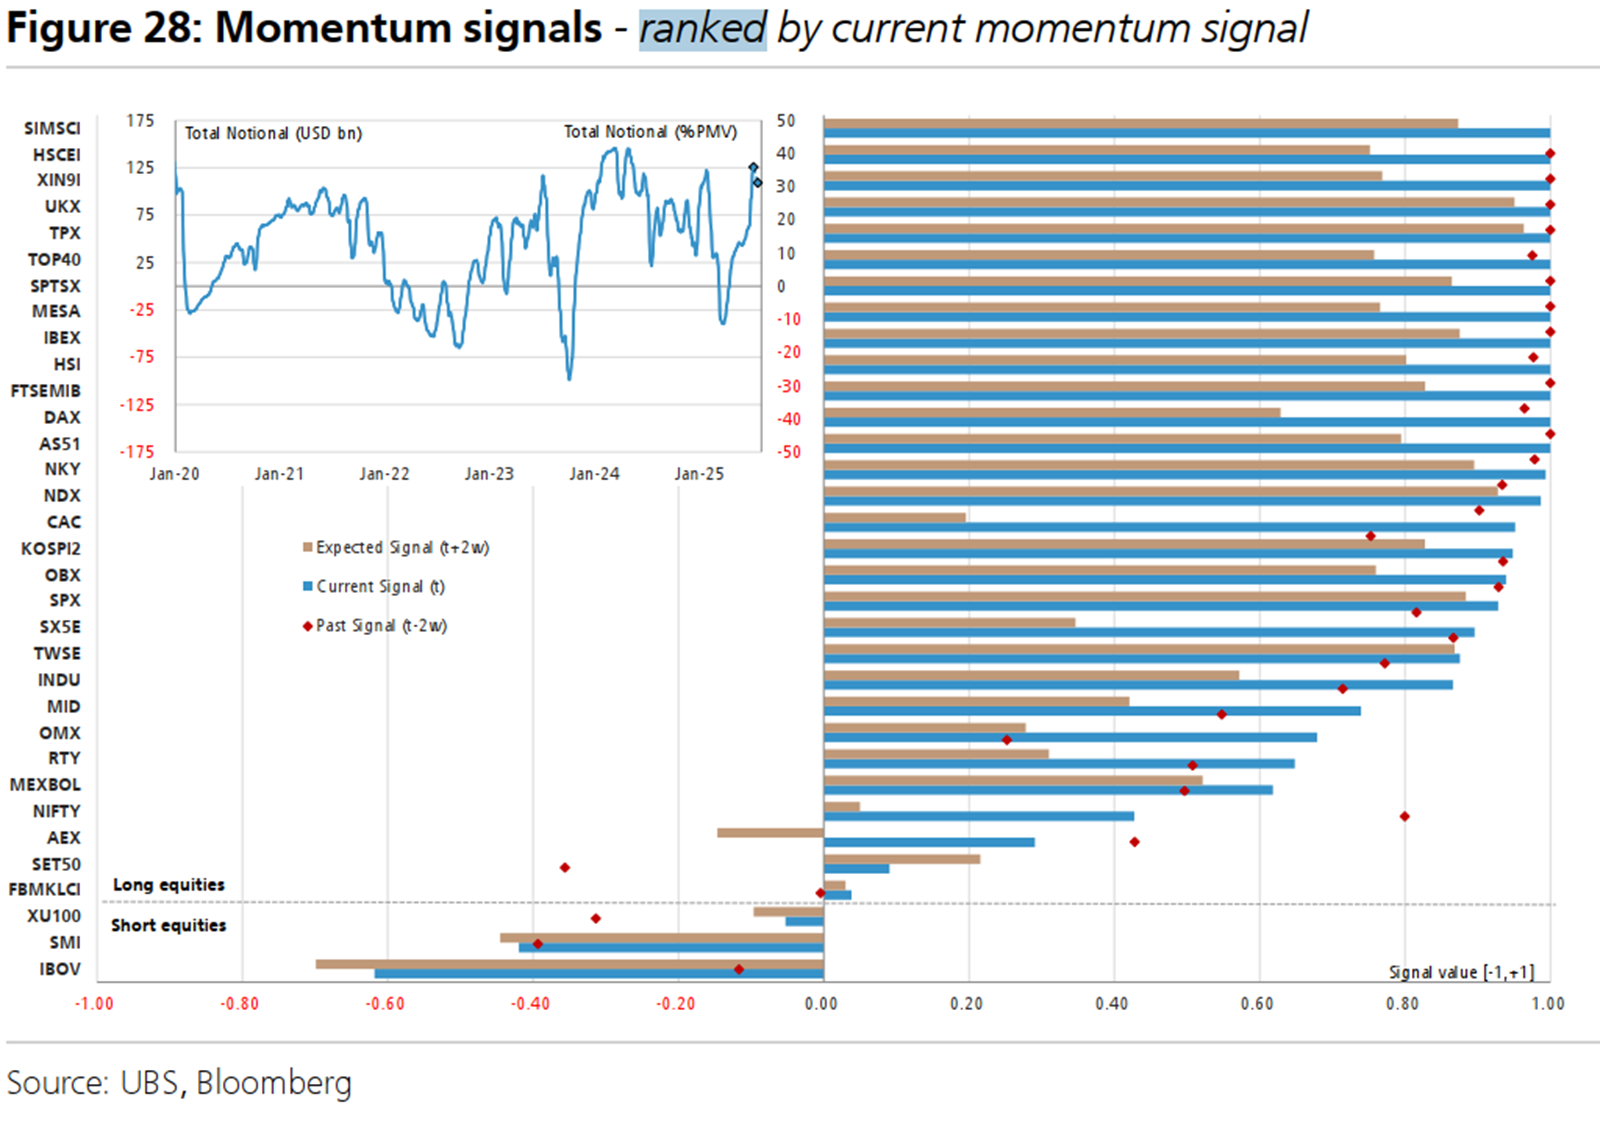
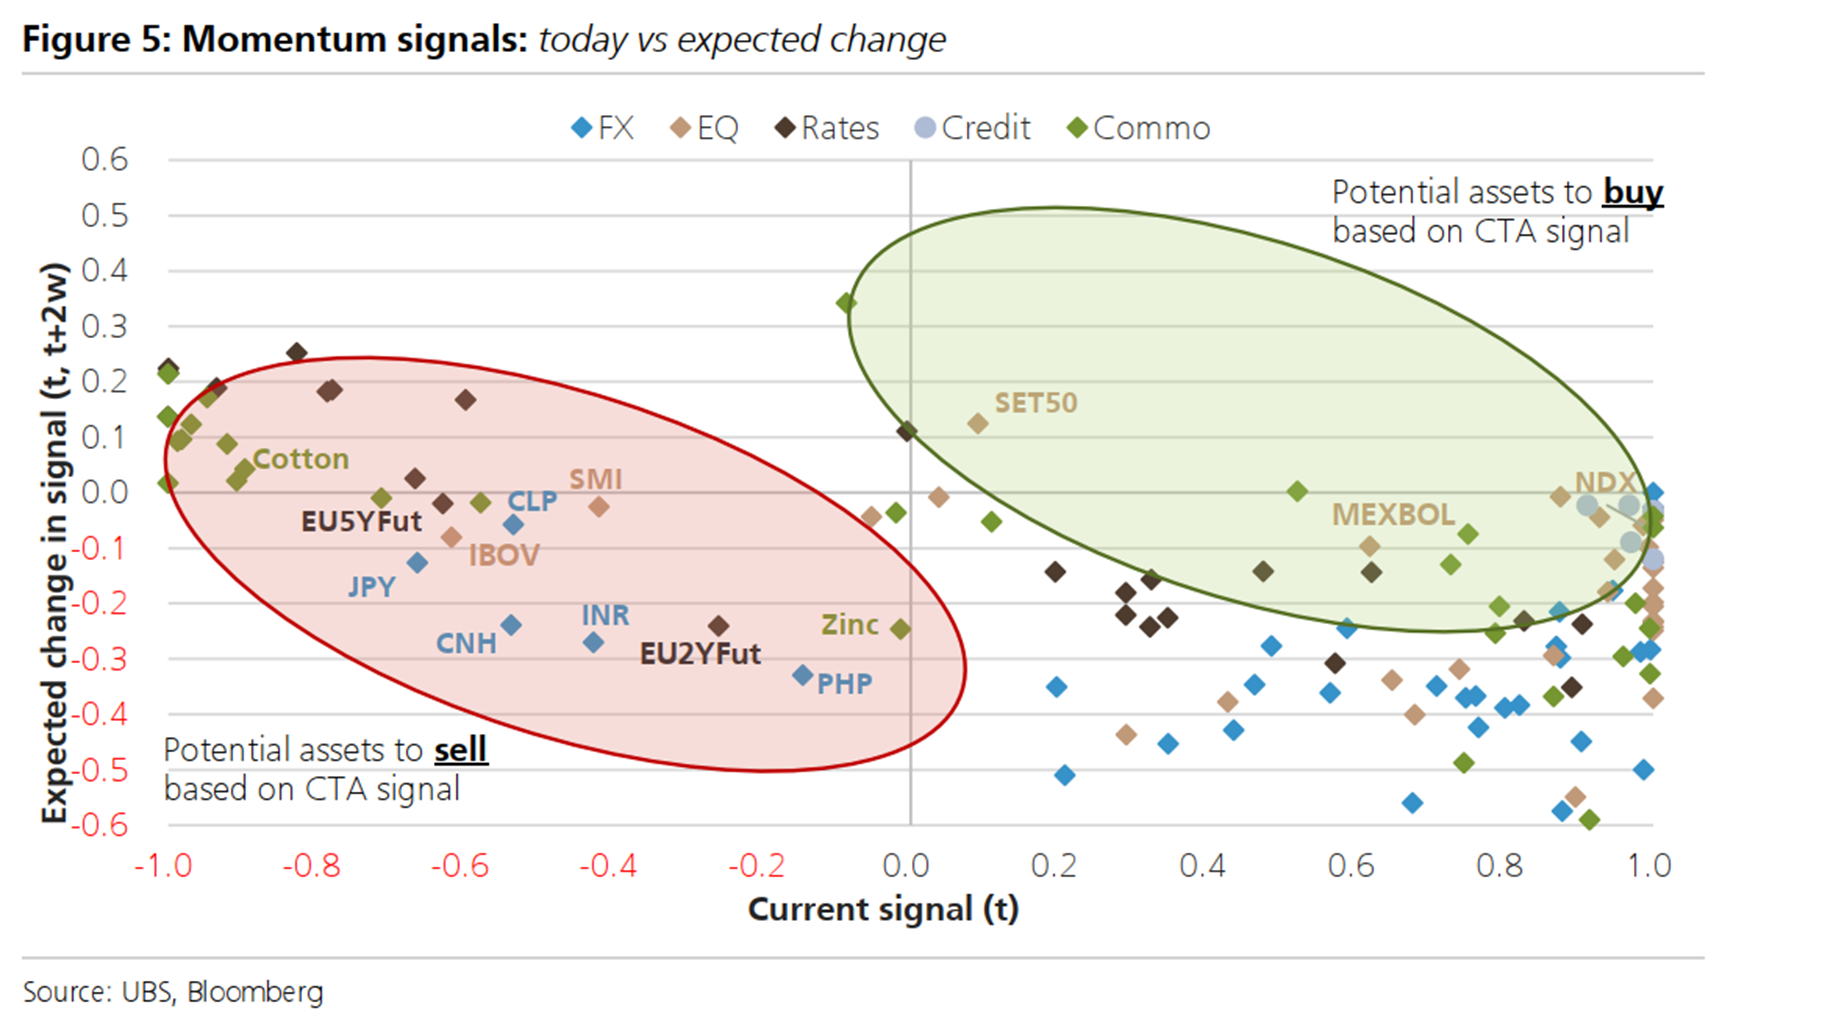
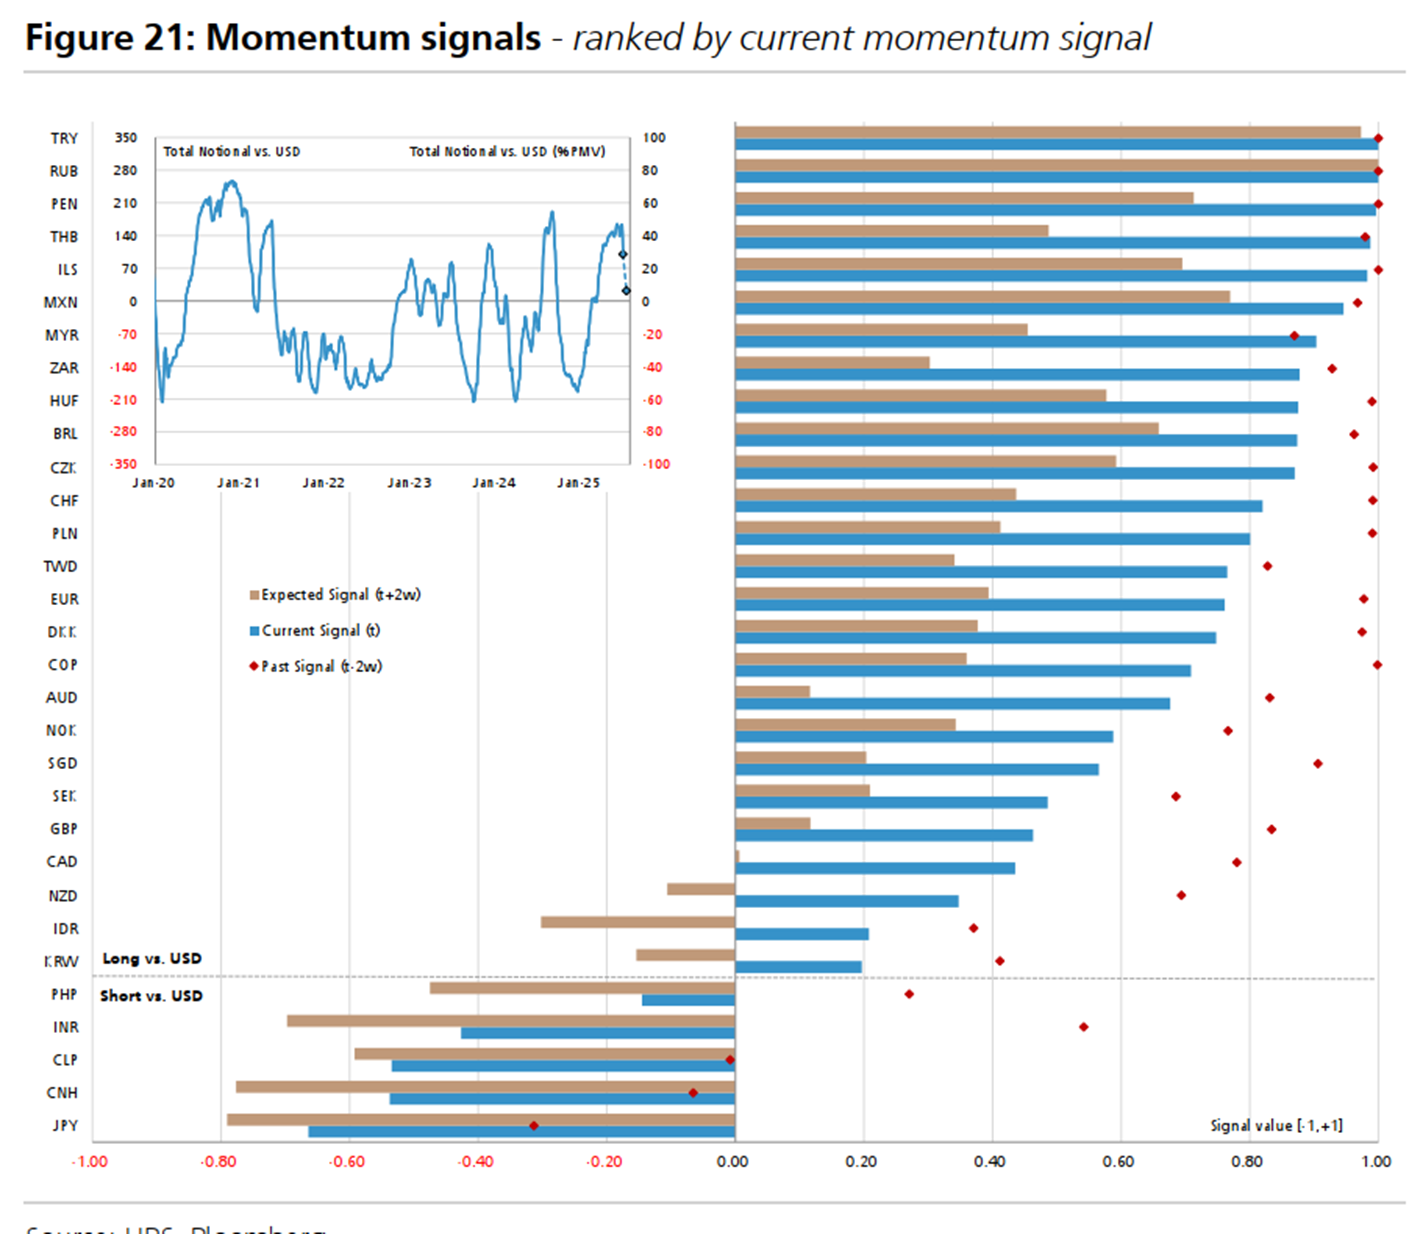
- UBS: CTAs are chasing JPY shorts and NDX longs. Chart shows potential assets to short or long based on CTA momentum signals.
- JP Morgan's data on CTA positioning shows a similar net long story across most multiple major equity markets.
- CTAs are still heavily short the US dollar. UBS shows that while they have scaled down their exposure during the recent dollar bounce, they remain very short. Indiscriminate USD selling over? A signal for a short-term revival in the USD perhaps?
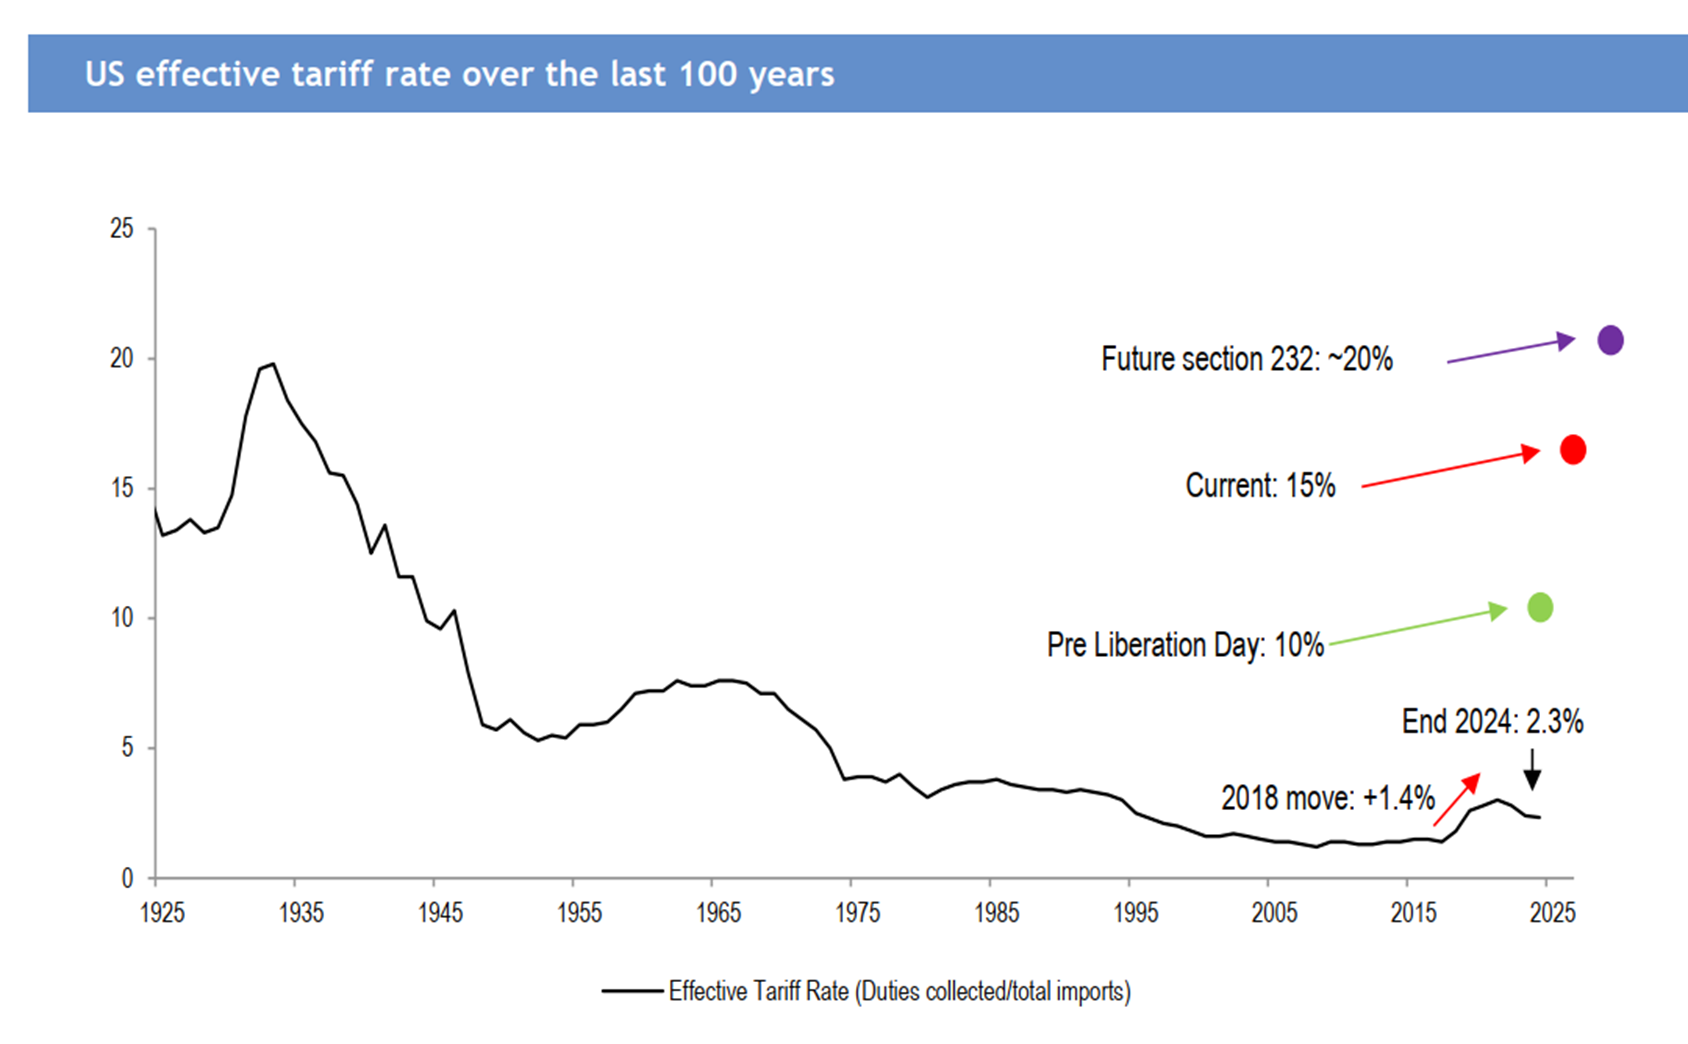
- The US effective tariff rate has been relatively low in an increasingly globalised world; but note the ETR implied by section 232. Yep, bit of a brow-raiser...
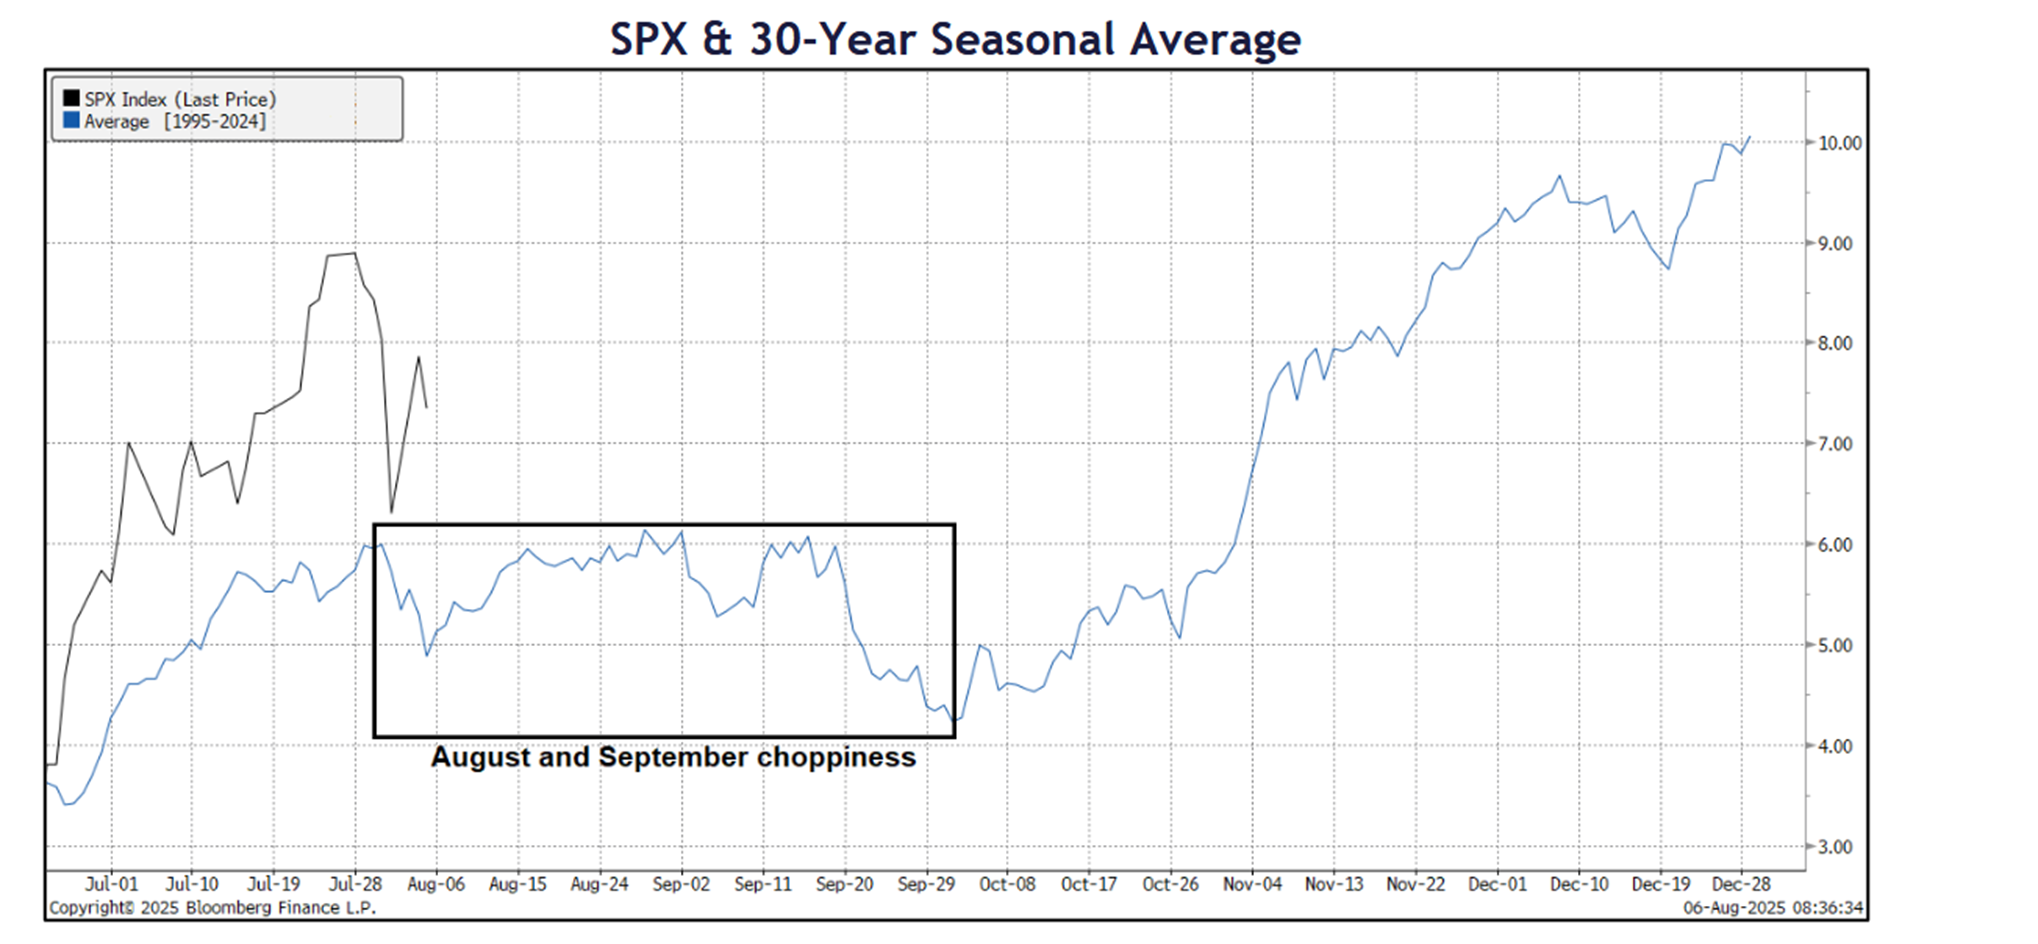
- A Choppy August and September. S&P 500 seasonal pattern shows risks are to the downside for the index.
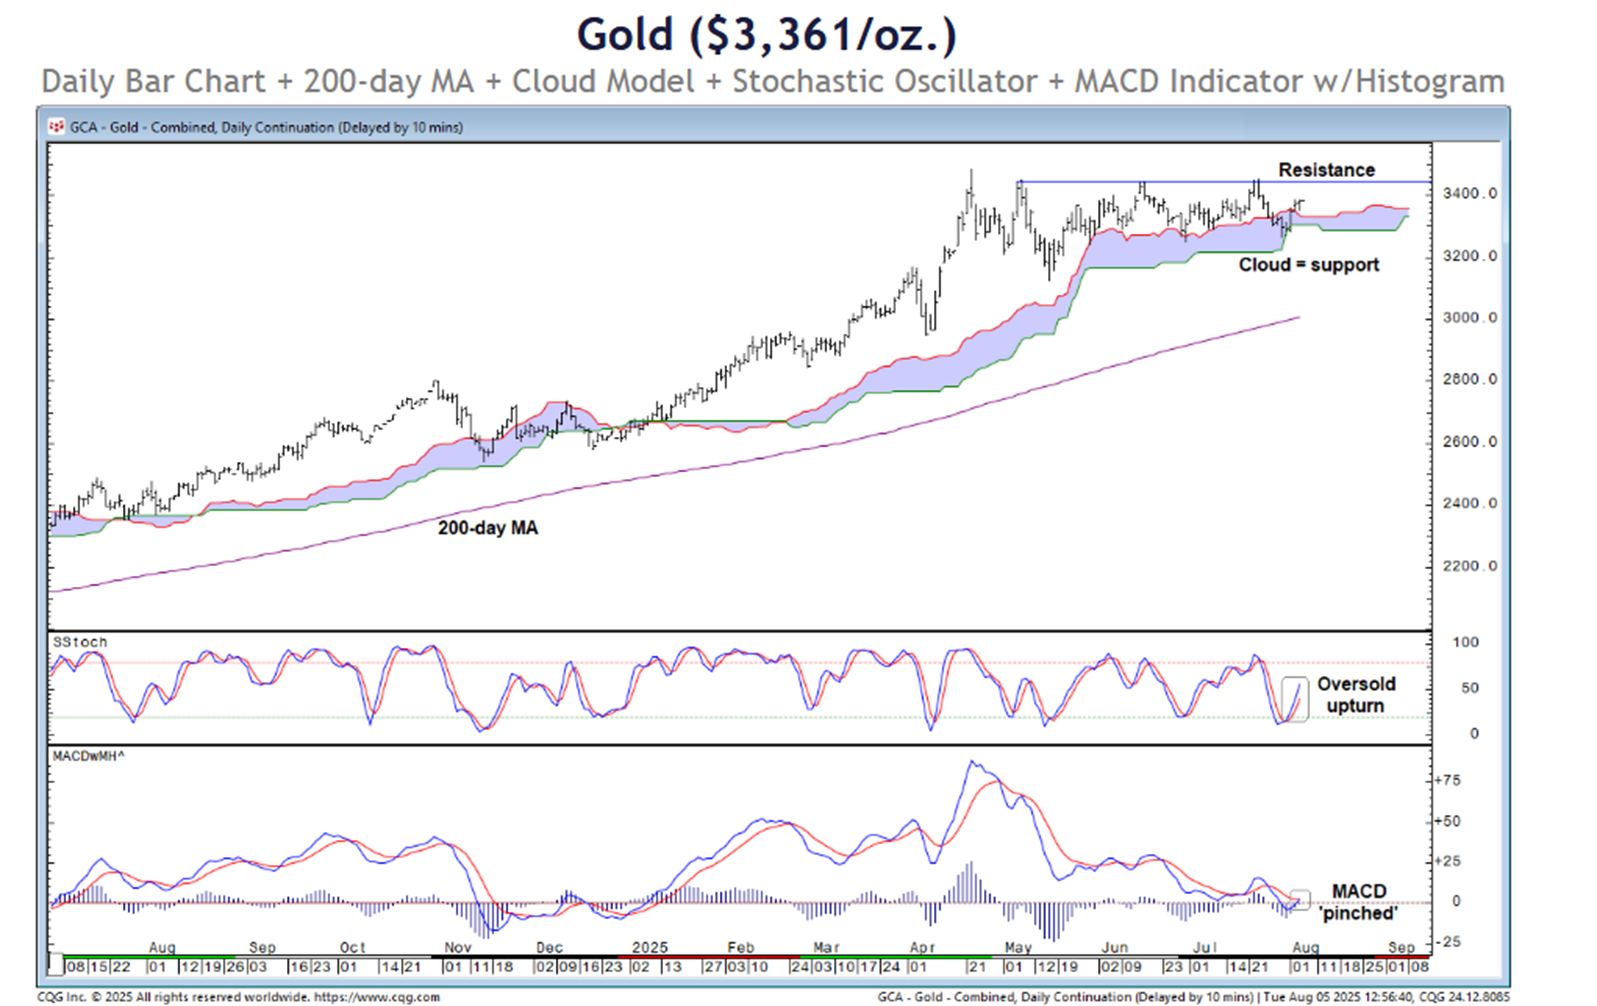
- Gold futures had been range-bound but a close above $3,486 on in GC would provide confidence for the $3,760 projection.
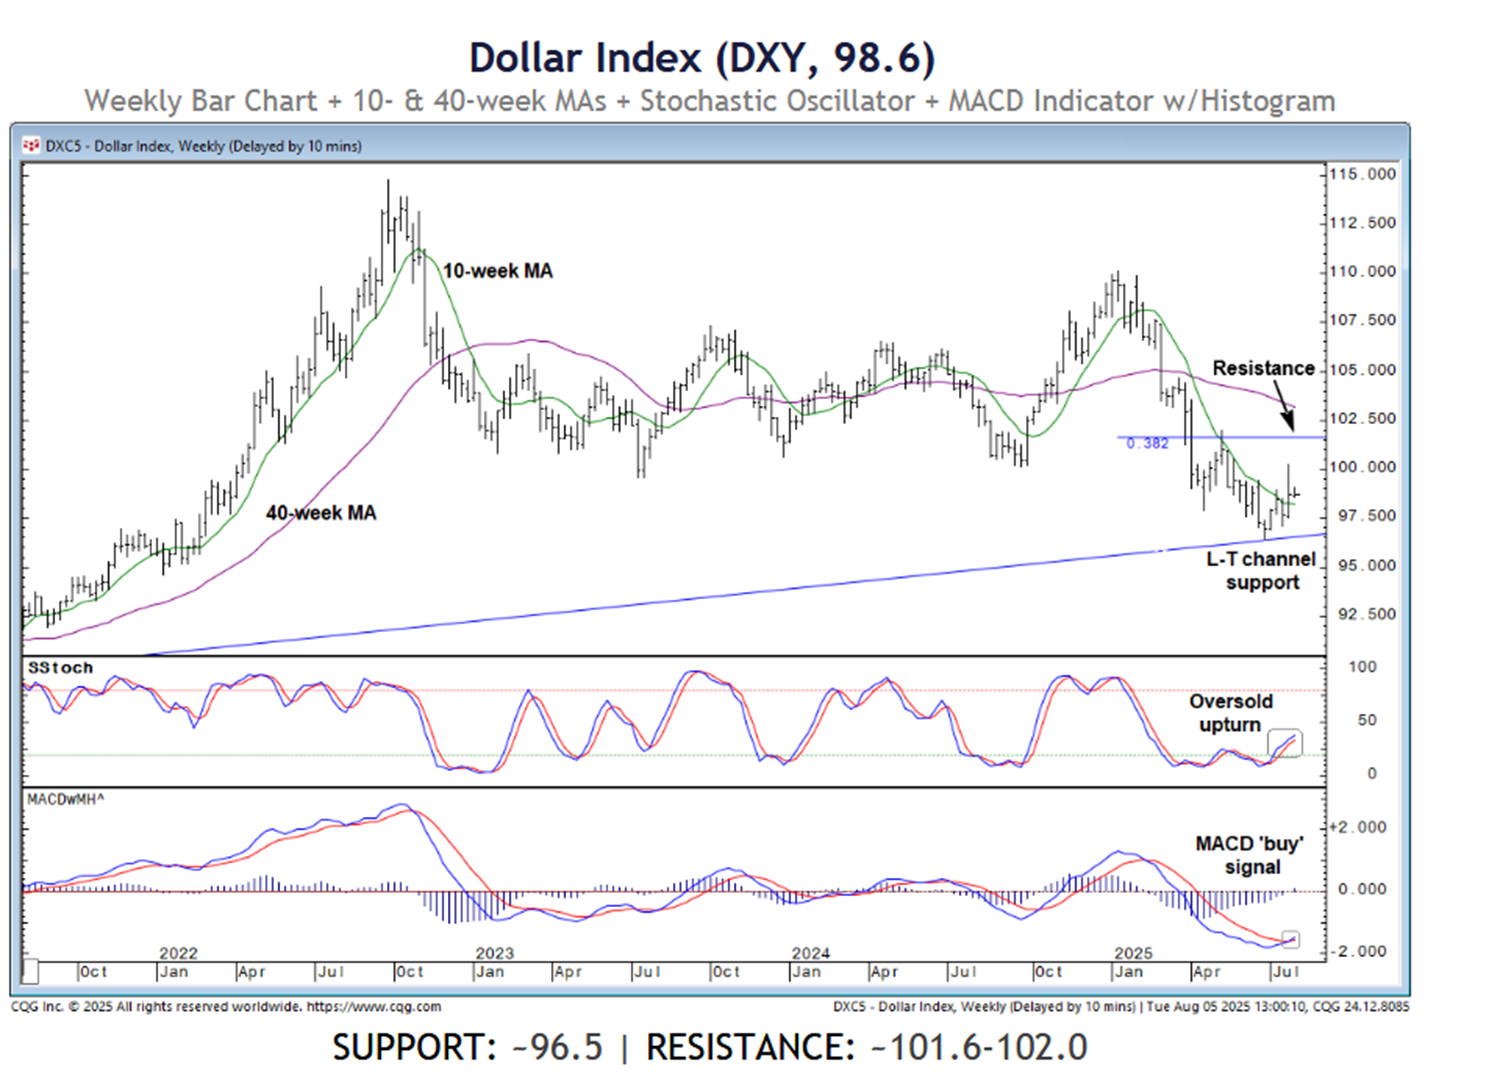
- On the DXY weekly, long-term trendline support held, leading to a small counter-trend rally, and supported by bullish crosses in momentum indicators.
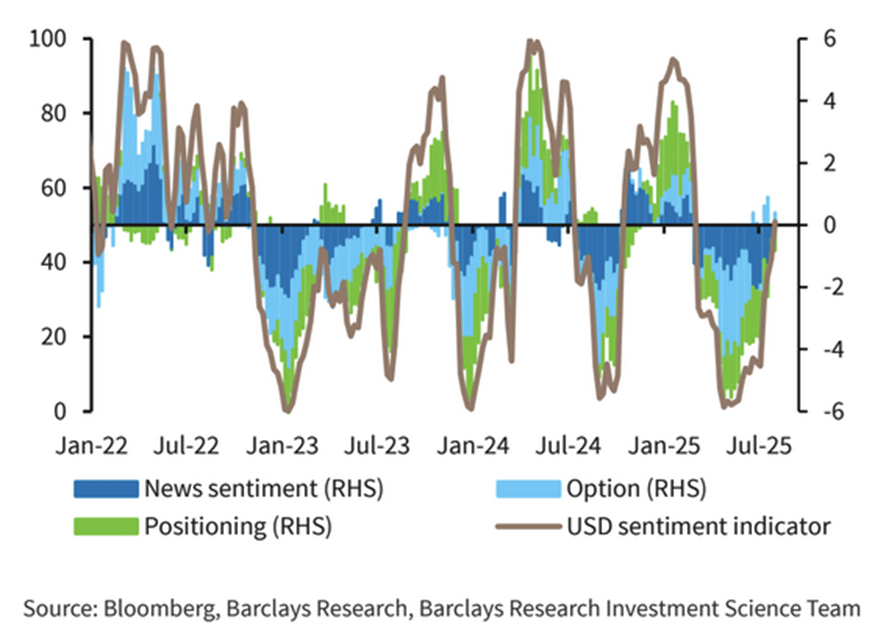
- Barclays' sentiment indicator for the USD has returned to a neutral position.
- Massive de-grossing equity exposures by Hedge Funds. Largest since March 2020 according to the 20-day change in GS prime book.
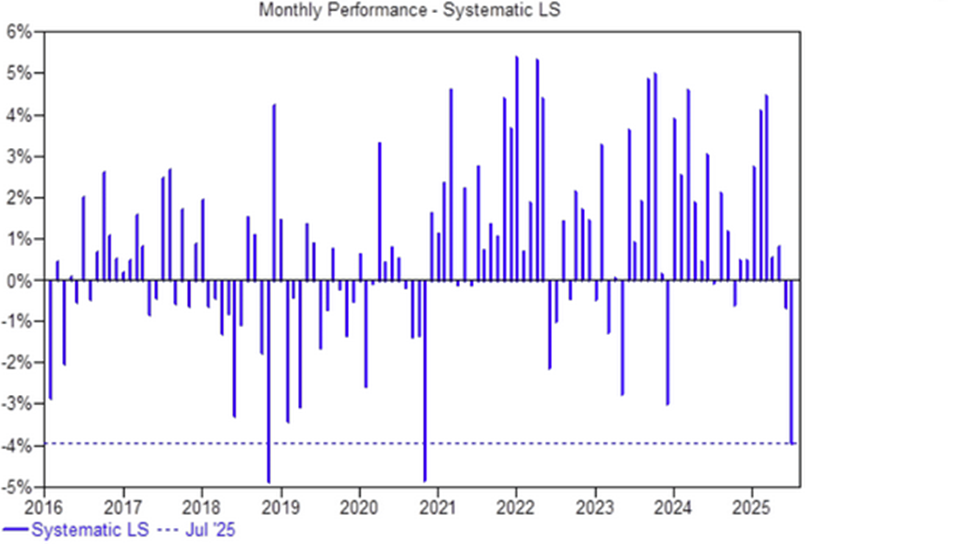
- Also from GS, systematic long/short hedge funds had their third-worst monthly performance in July 2025 in their entire data history.

Chartstorm is an unfiltered stream of visual data offering unique perspectives onFX, Indices and Commodities. It aims to present charts in a free-flowing form with minimal commentary, and intended to serve as a springboard for deeper thematic discussions, contemplation, as well as the generation of ideas.