2025.08.04 Weekly
Was it really that bad? A lot of data to unpack and definitely worth reviewing and to strategise around

Was it really that bad?
Hope you had a restful weekend. I usually 'DND' my phone into the weekend and the moment I turned it back on, I see a flood of notification previews with takes on last week’s data. Though I might have caught a few glimpses, I’m attempting to ignore them all as I want to think through the latest developments and its implications for myself, and without influence of others for the purpose of my own weekly exercise. There's a lot of data to unpack and definitely worth reviewing. Let's dive in!
LABOUR MARKET DATA
First, the July jobs report not only missed at 73k vs 110k expected, but also came with starling revisions to the June (- 133k) and May (-125k) reports totaling a hefty 258k of downward revisions. That sent the 3-month average of payroll gains being well below 100k to now just 35k.
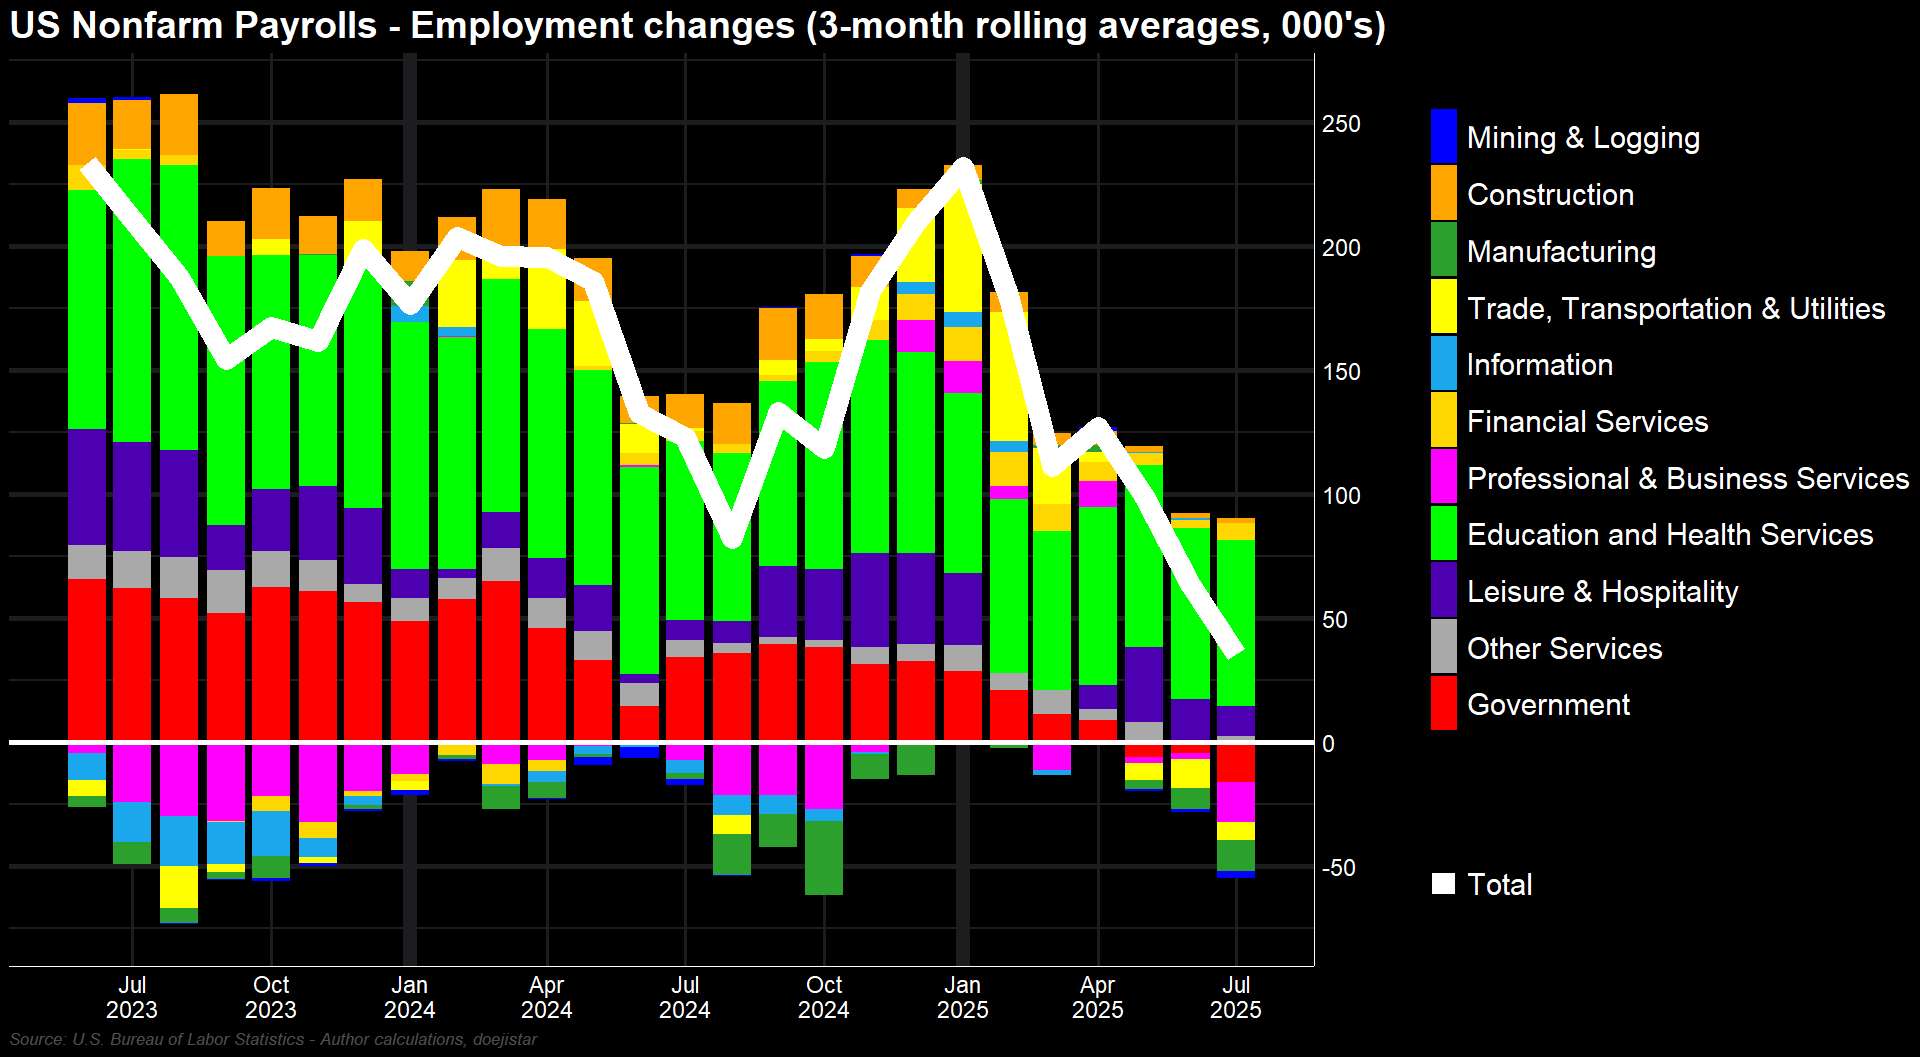
While the Q1 pace of cooling into the low 100’s could be characterized as moderation, the trend since April has seen increasingly negative jobs growth in Professional/Business services, Trade/Transportation/Utilities, and Manufacturing which looks largely symptomatic of the uncertainties created by Trump’s trade policies.
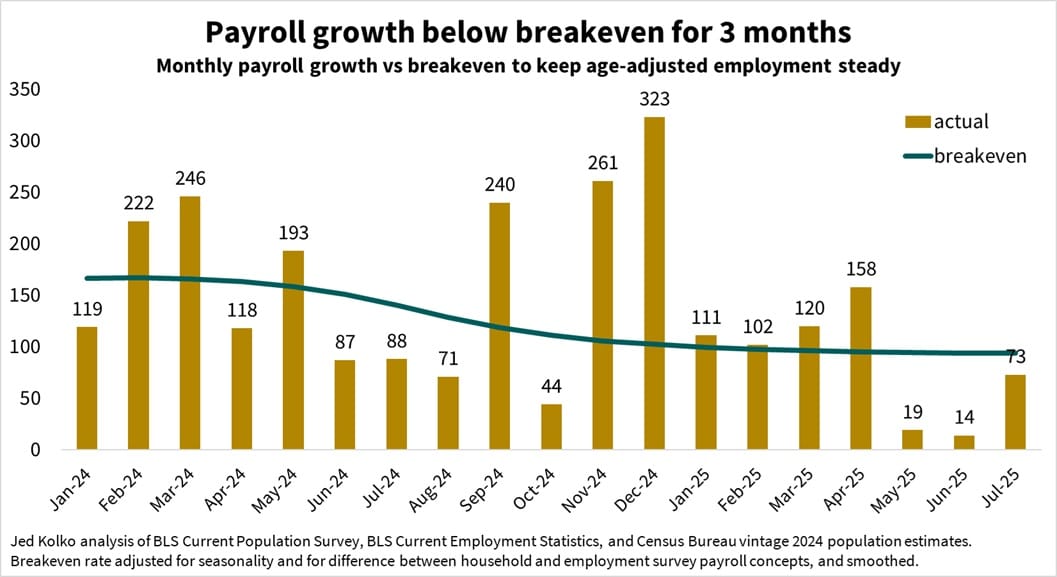
Powell noted that the breakeven job growth has fallen, almost as if said that with some emphasis. Considering that we’ve had above breakeven jobs growth in the early part of the year then dropped off sharply post Liberation-day, the YTD-average – for some perspective, is at 85k, which isn't far off the breakeven level of monthly job growth at 87k. Okay, not great... But let's dig deeper!
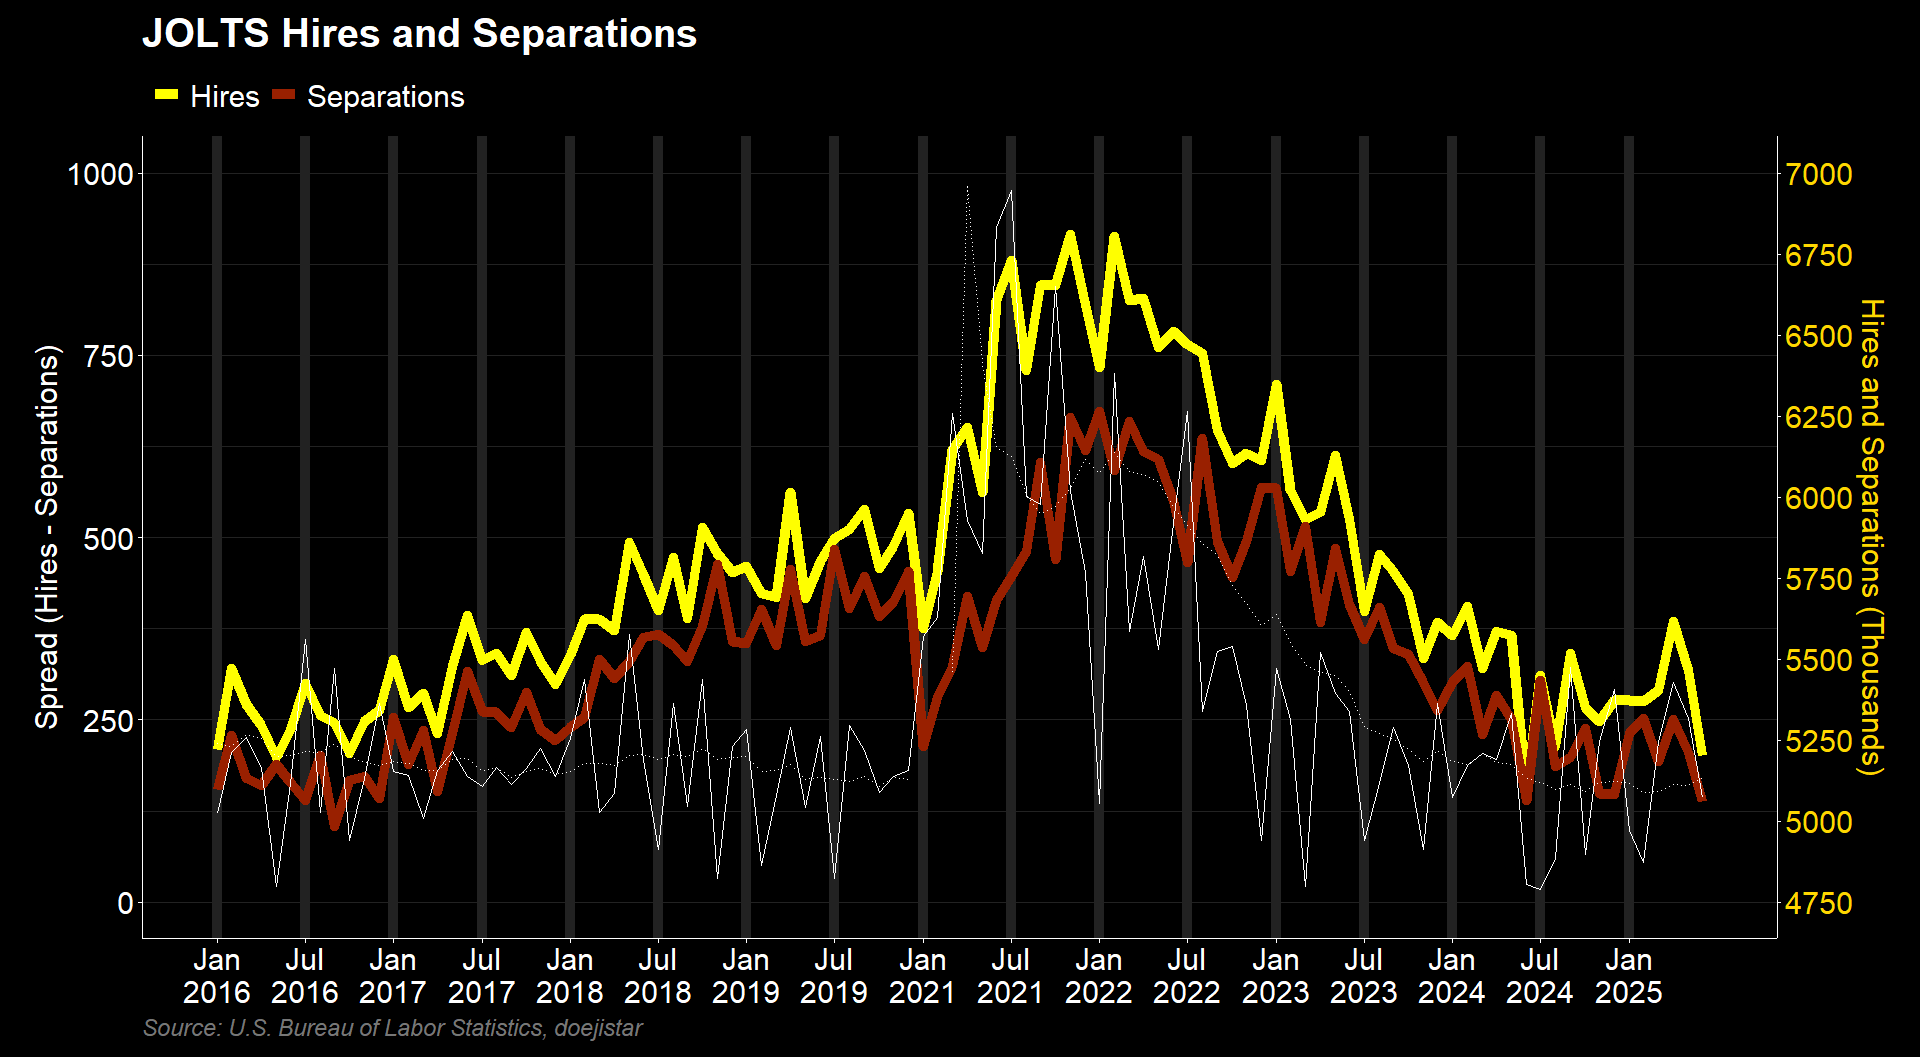
While those headline NFP figures do look alarming, I do feel however that it is important to keep in mind that we have an entirely different labour market than what we’ve witnessed the prior 5-years. Hiring and separation levels are consistent with levels Trump inherited in his first term, and for context - the BLS said in 2016:
"The rate of labor market 'churn'―the proportion of people changing their labor force status―hit its lowest point since the series began in 1990."
Notice in the above chart that 1) labour market turnover turned higher further into Trump 1.0 as his fiscally expansionary policies took hold via his Tax Cuts and Jobs Act in 2017, and increased Defense spending in 2018; then 2) surged during the pandemic spending into a period that was dubbed the “The Great Resignation”. That 5-year period from 2017 to 2021 was quite simply, exceptional. The kind of stale labour market dynamics as reflected by the most up to date NFP numbers we are increasingly seeing, I'd aruge, is just symptomatic of a structural shift to what the Fed describes as “being in better balance”.
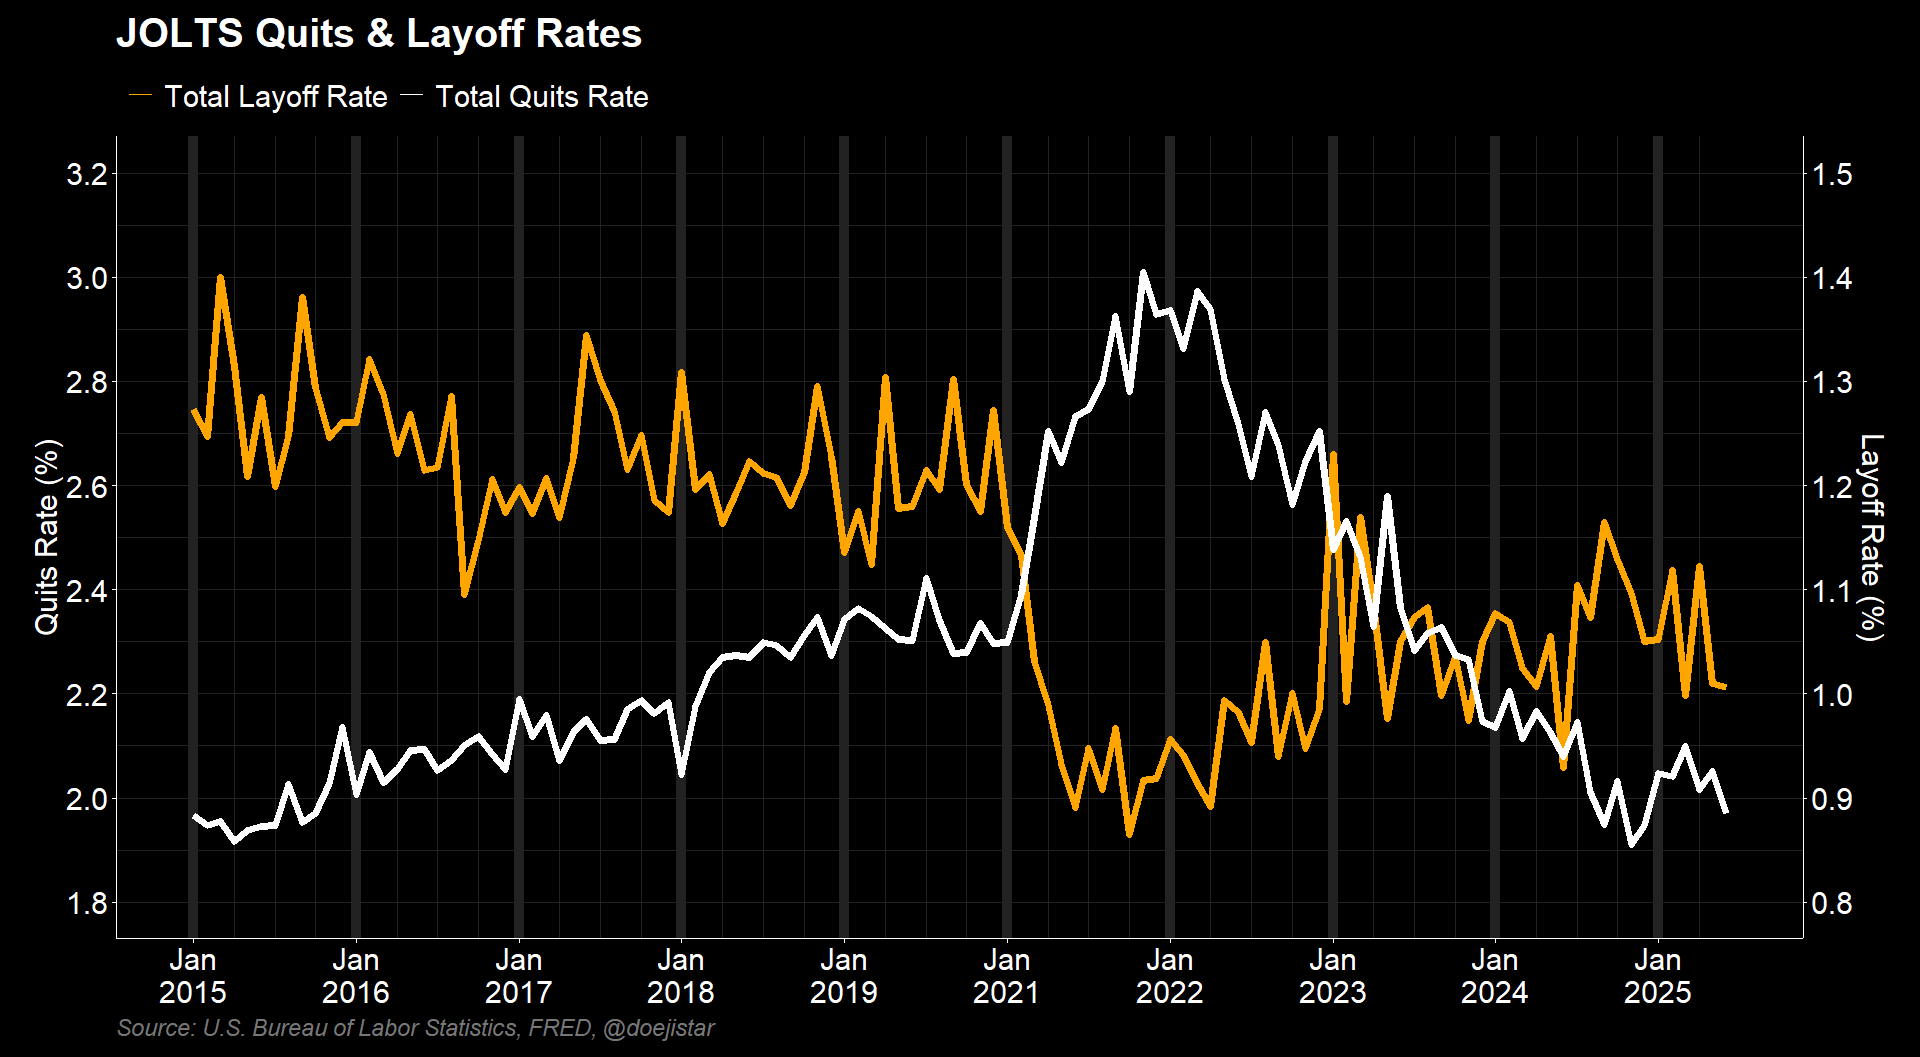
“The Great Resignation” is better depicted in this chart above – Quit rates surged and rate of layoffs plummeted; and now we’re seeing the opposite. This lends some evidence that what we’re seeing in the labour market is merely a structural adjustment; and on that basis, would imply that quick conclusions about the labour market being severely weak as recent headline numbers would suggest could very well be premature. Judging by recent Fed’s comments, it seems they would agree.
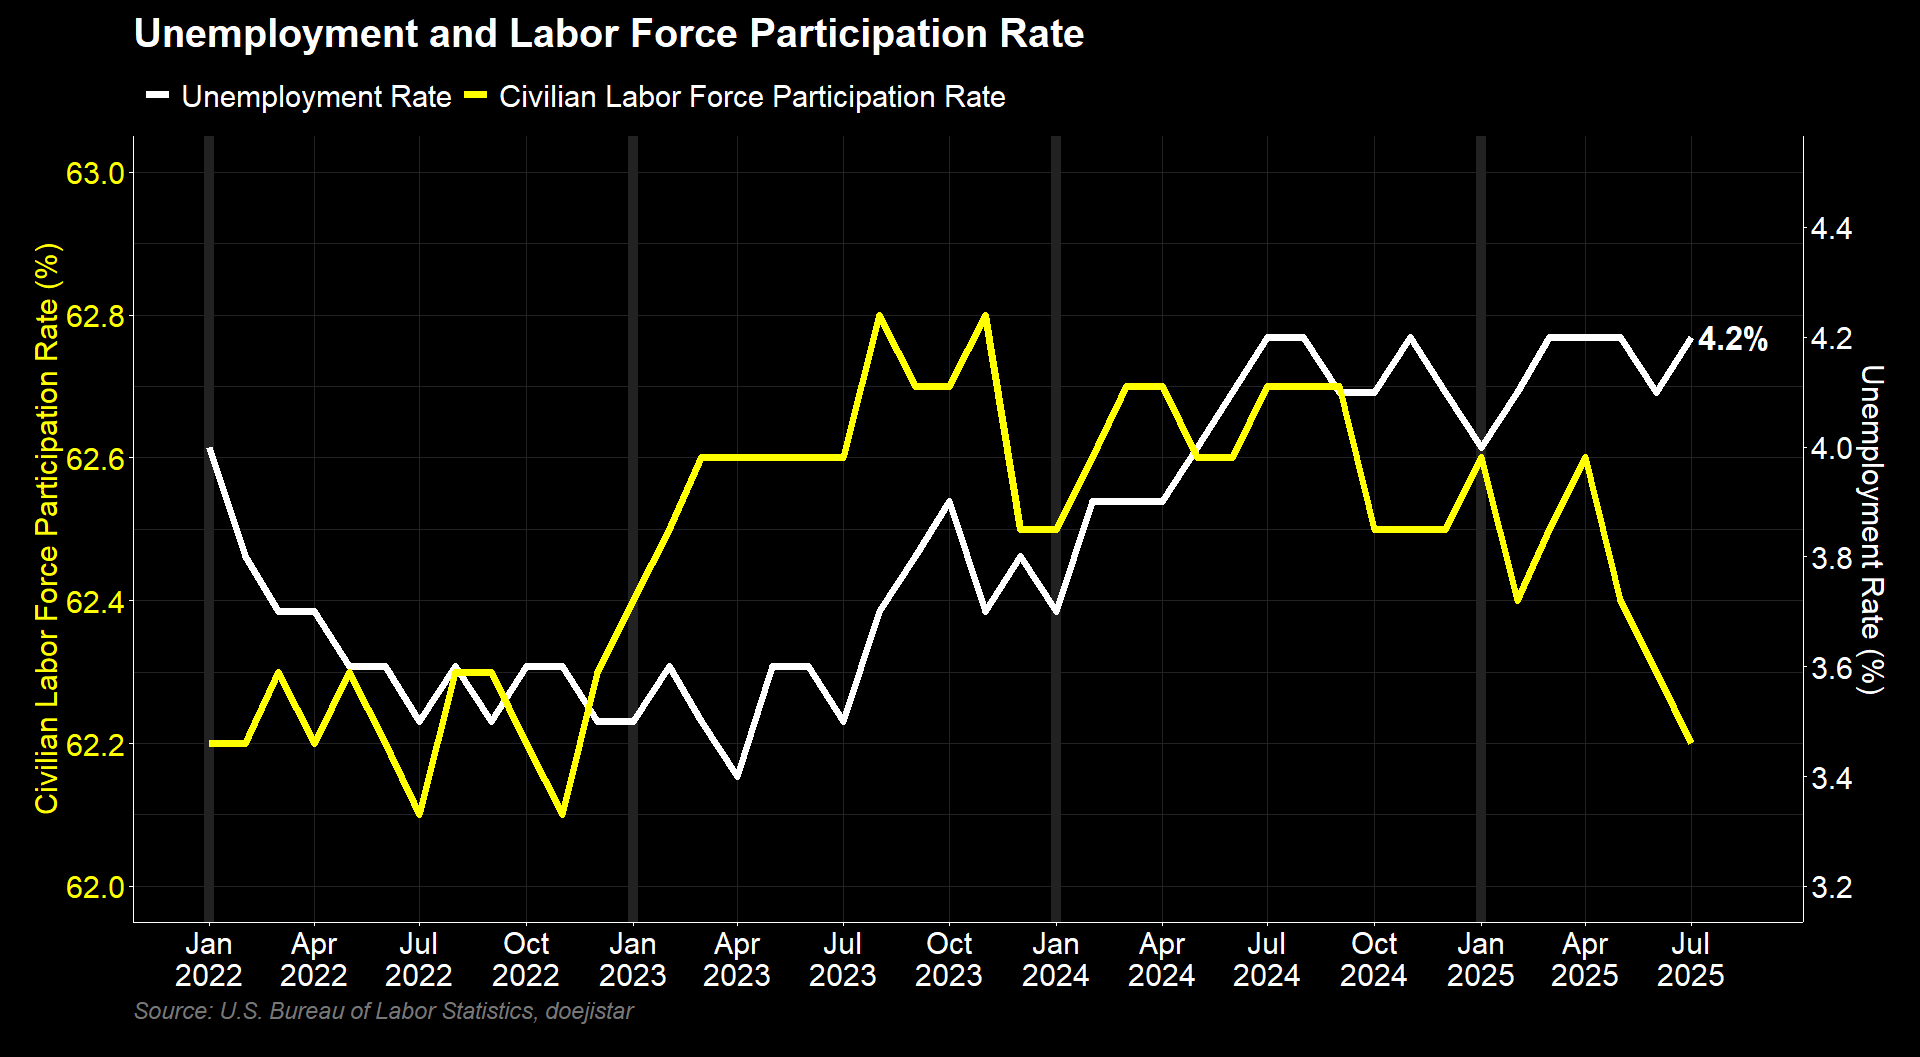
For much of those reasons I’ve made above about a structurally different labour market, I did think the Unemployment number would be particularly important for this NFP – as Powell did emphasise last Wednesday:
“MAIN NUMBER YOU HAVE TO LOOK AT NOW IS THE UNEMPLOYMENT RATE”
Brent Donnelly in his NFP preview also shared the same sentiments, but little did we know that the revisions would be so staggering that those became the main focus of the jobs the report. At any rate, the UE number, though coming in as expected printed a cycle high, as Nick Timiraos noted:
“Unrounded, the unemployment rate in July was 4.248%, which is the highest since October 2021. It was 4.244% in May.”
Splitting hairs with those numbers but considering that LFPR was lower than it was in May and at the lowest in about 2.5 years, I wouldn’t get carried away with this UE number edging out the May unrounded number.
As for the LFPR, I’m no economist (just a trader that loves to analyse and formulate my own opinions than rely or be swayed by anyone else’s) but I’m sure there are plenty of other nuanced reasons to explain this trend and probably some work done on this out there; e.g. tighter immigration policies, aging workforce, healthy capital and crypto markets in recent years may have discouraged new entrants from getting a ‘real job’, perhaps college students unable to find a job easily are entering the gig-economy that may not be immediately captured in the labour force reporting. Whatever the reason, the world does seem a little different to what it was pre-pandemic and I think the answers lie in some of those hidden and unconventional trends, on top of the obvious demographic changes.
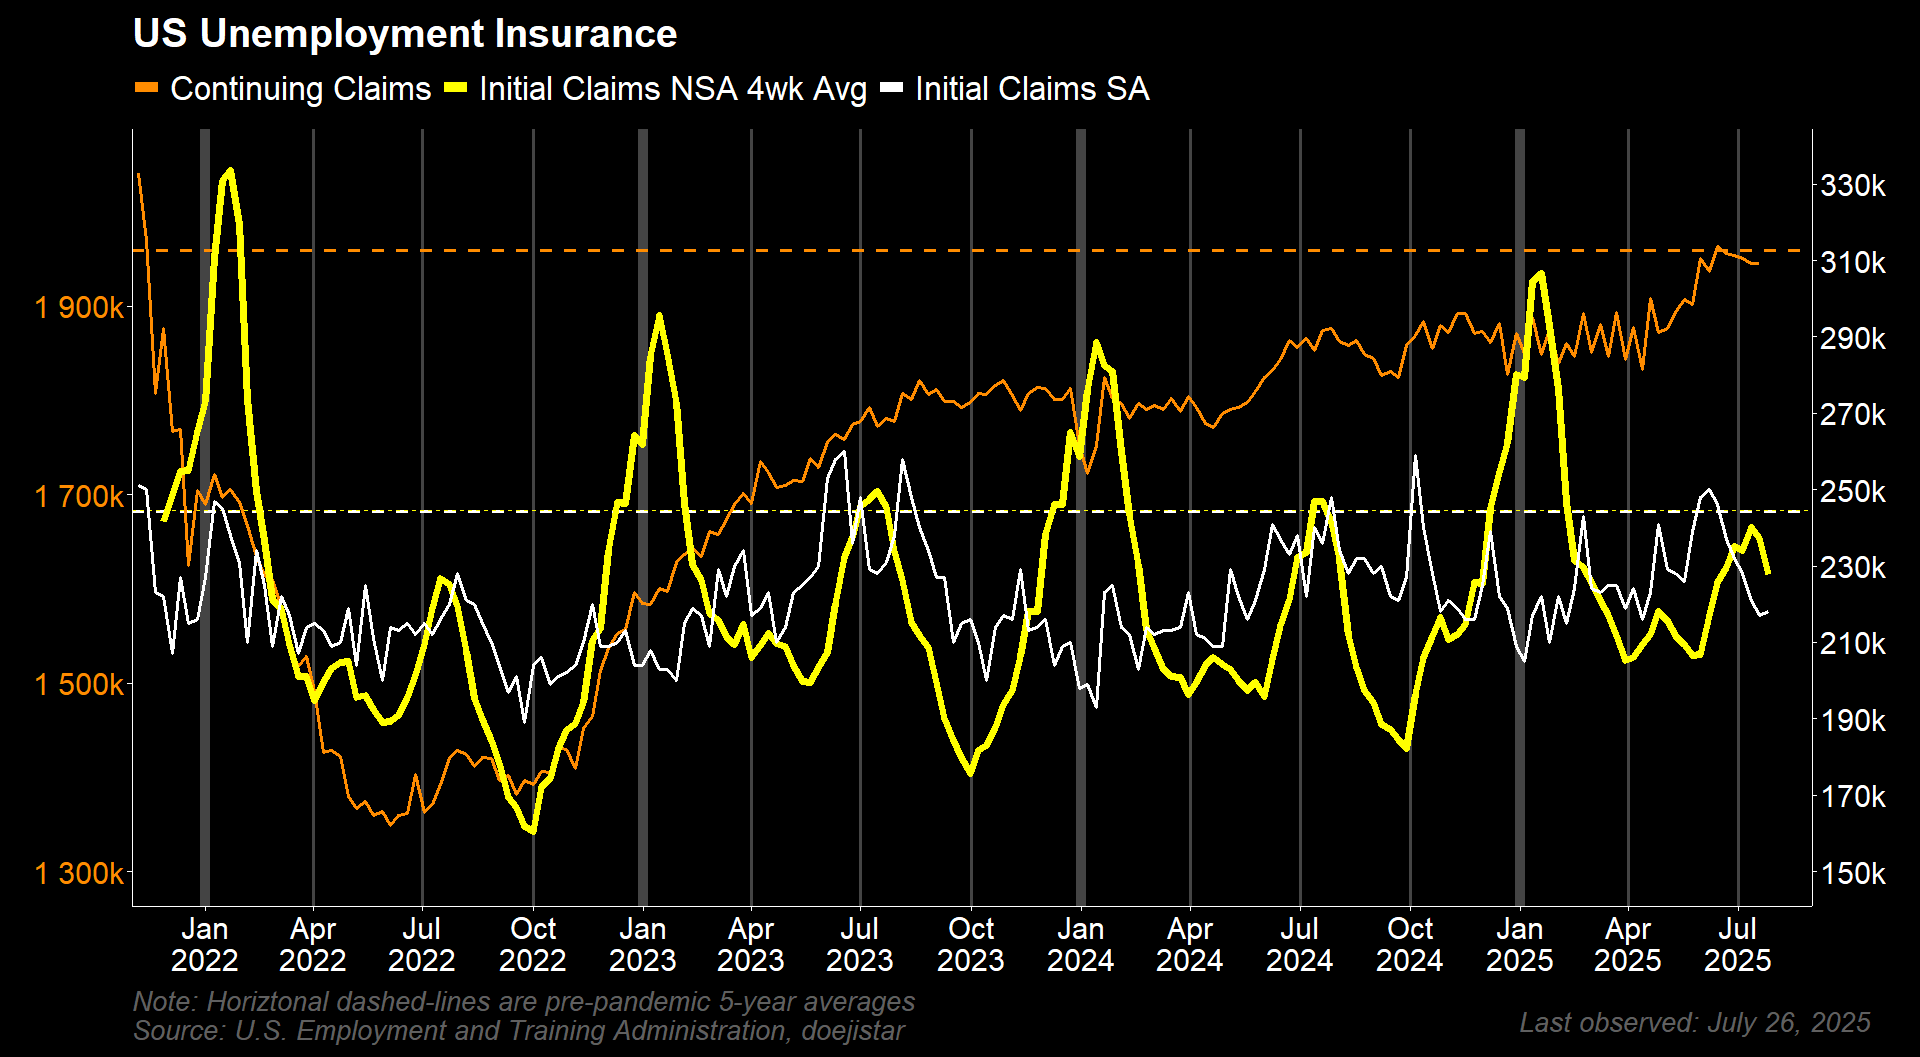
Initial claims rose slightly by 1k to 218k, which was lower than the 224k expected. The non-seasonally adjusted figure continued to roll over from its peak and following the seasonally pattern we've been watching since mid-July.
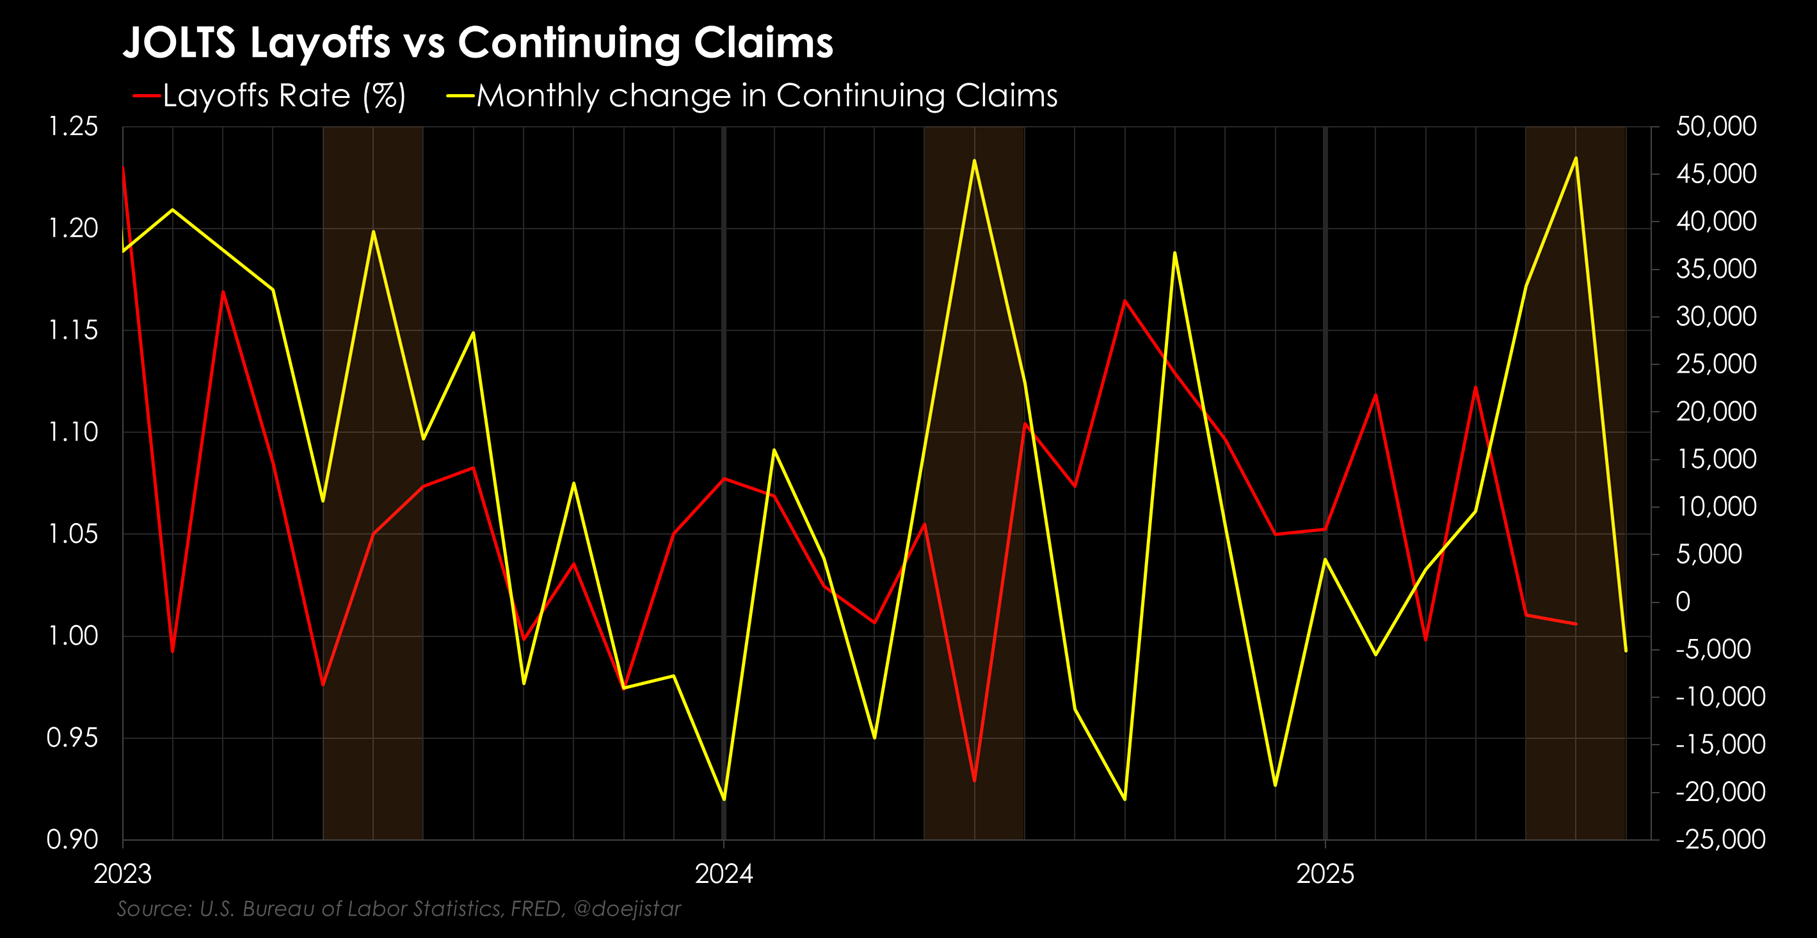
Continuing claims printed 1,946k, which was 14k lower than expected and on a smoothed monthly-basis - July retreated after a steep rise during the weak NFP months. Layoffs have remained low all the while... Could the seasonal pattern be pointing to improving labour market conditions over the coming months?
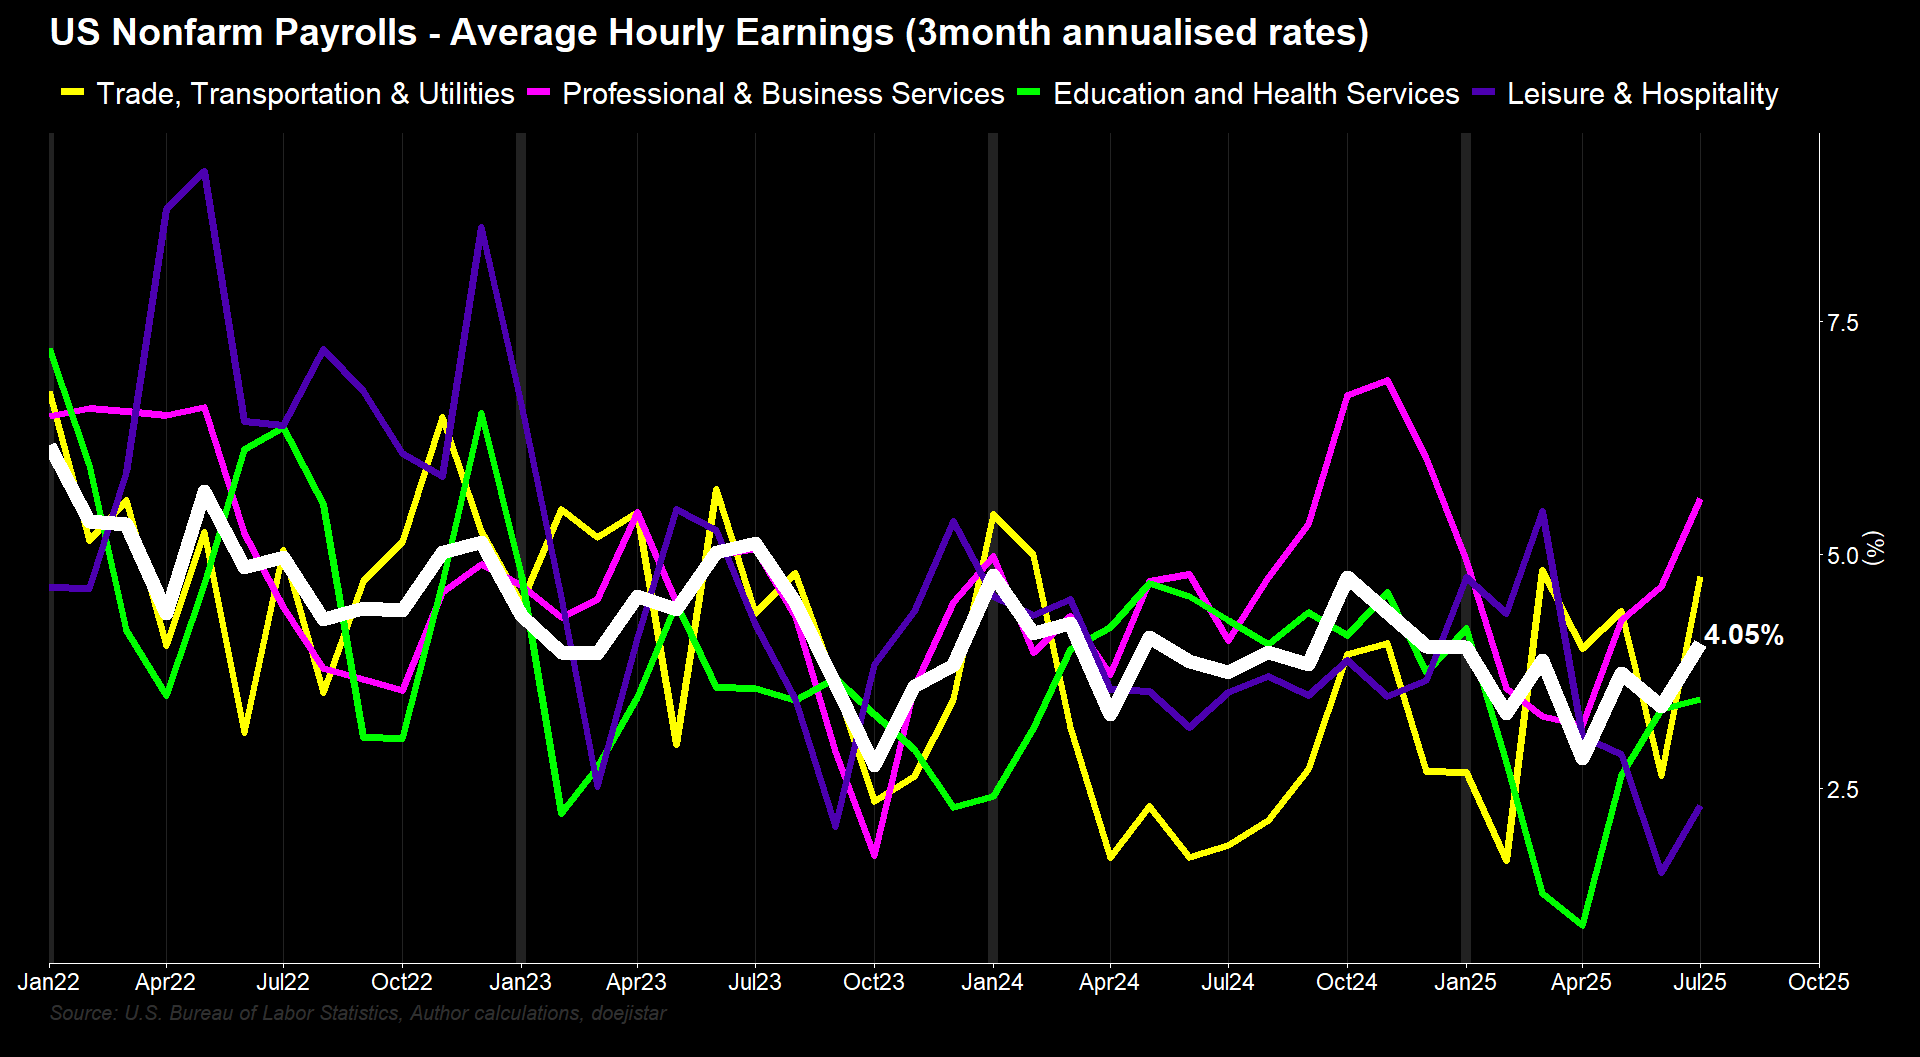
Moving onto wage growth, the 3-month annualised rate of AHE is now the fastest pace since November of last year at 4.05% while AWH (average weekly hours) held steady for the most part this year. Also if you looked at just at the negative jobs growth in Professional/Business services, you could easily think there are major cracks beginning to form in the labour market. Wage growth for that section over the last 3-monts has soared from about 3% to above 5% on a 3mo-annualised basis - there really is nothing about wage growth ripping in that sector to suggest weakness. And what about Trade/Transportation/Utilities, very weak jobs growth in recent months but wage growth has accelerated from below 3% to close to 5%.
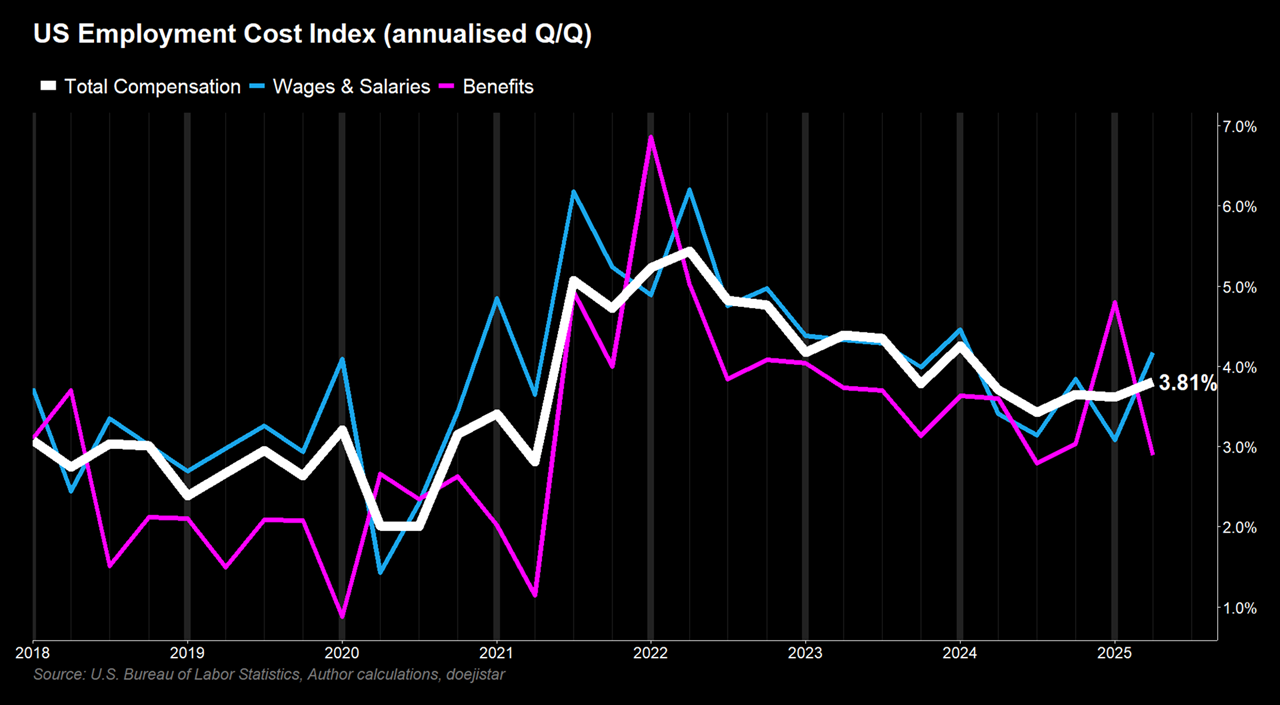
ECI, a bit of a favourite among the Fed as they regularly cite this measure in their speeches over the years describing it as their preferred or “gold standard” wage inflation metric. The QoQ measure has been steadily rising since the mid-2024 labour market related growth-scare and now sits at 3.81%, and consistent with the YoY establishment survey reading of 3.77% as of June, and 3.91% as of the July report last Friday.
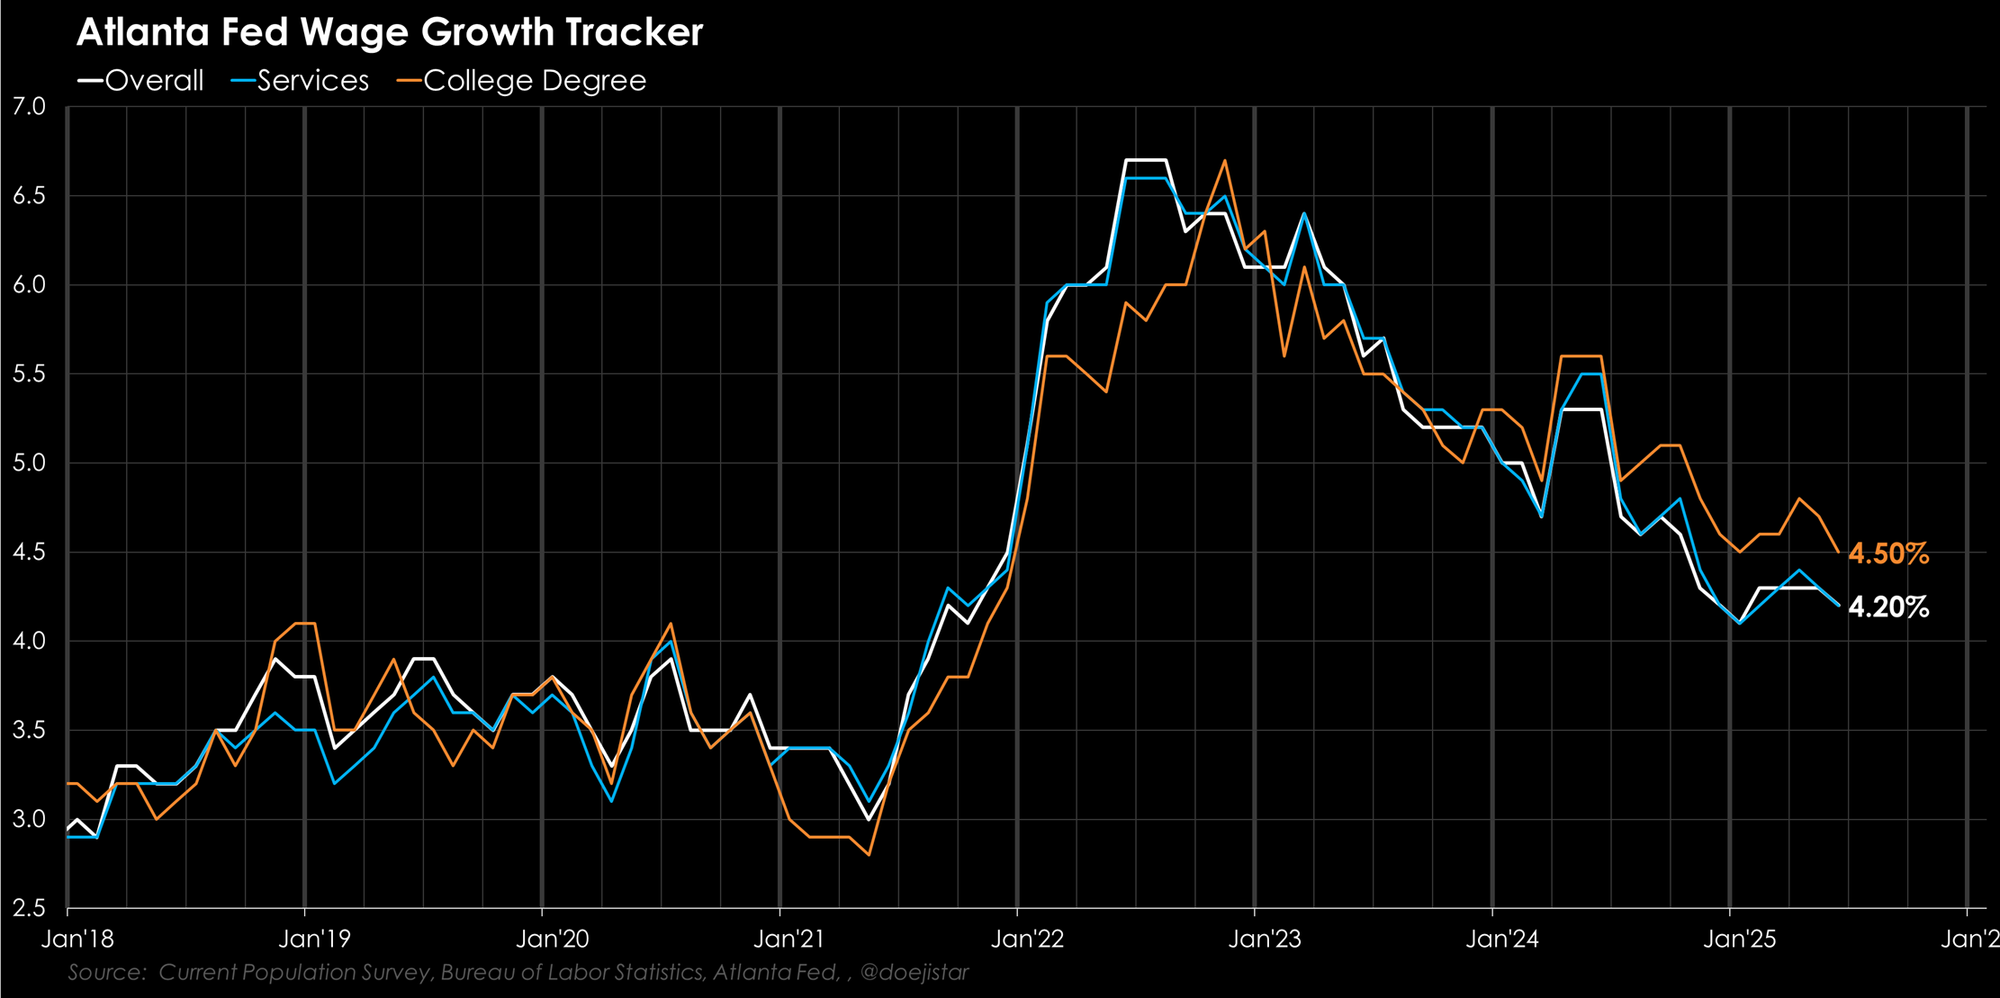
The Atlanta Fed measure sits at the highest of all those at 4.20% YoY for the 'Overall' and 'Services' categories – strong…...
Let's briefly summarise what we can infer from the most recent labour market data:
- Massively disappointing jobs growth numbers; BUT…...
- structural dynamics are very different than in previous years;
- hiring and separation patterns looks much like the stable low-churn of 2016,
- Layoffs are very low!
- wage growth is strong across multiple measures and in sectors that are seeing weak jobs growth. How can that be construed as weak?
- Fed emphasized the importance of the unemployment rate, which is contained and against some deeper demographic and structural shifts.
As JPow would likely say in reaction to the jobs report, he’d repeat what he said at the presser:
JOB MARKET IS NEAR MAXIMUM EMPLOYMENT (yes, nothing in that data to worry about)
MAIN NUMBER YOU HAVE TO LOOK AT NOW IS THE UNEMPLOYMENT RATE (i’m hearing you Jpow, but will the market?)
BREAKEVEN NUMBER FOR JOB CREATION HAS COME DOWN (yep, ytd just about holding up to that breakeven, lets see next month’s jobs report)
TOTALITY OF LABOR MARKET DATA SHOWS SOLID MARKET (indeed it still does)
21 EMPLOYMENT AND INFLATION REPORTS BEFORE NEXT MEETING AND WE'LL SEE WHERE THAT TAKES US (🤝)
Now that we’ve had a deep dive of the data, let’s look at what’s priced, and talk about the appropriate strategy for the week/2...