2025.07.28 Weekly
Seasonals are strong, but will it play out?

Seasonals are strong, but will it play out?
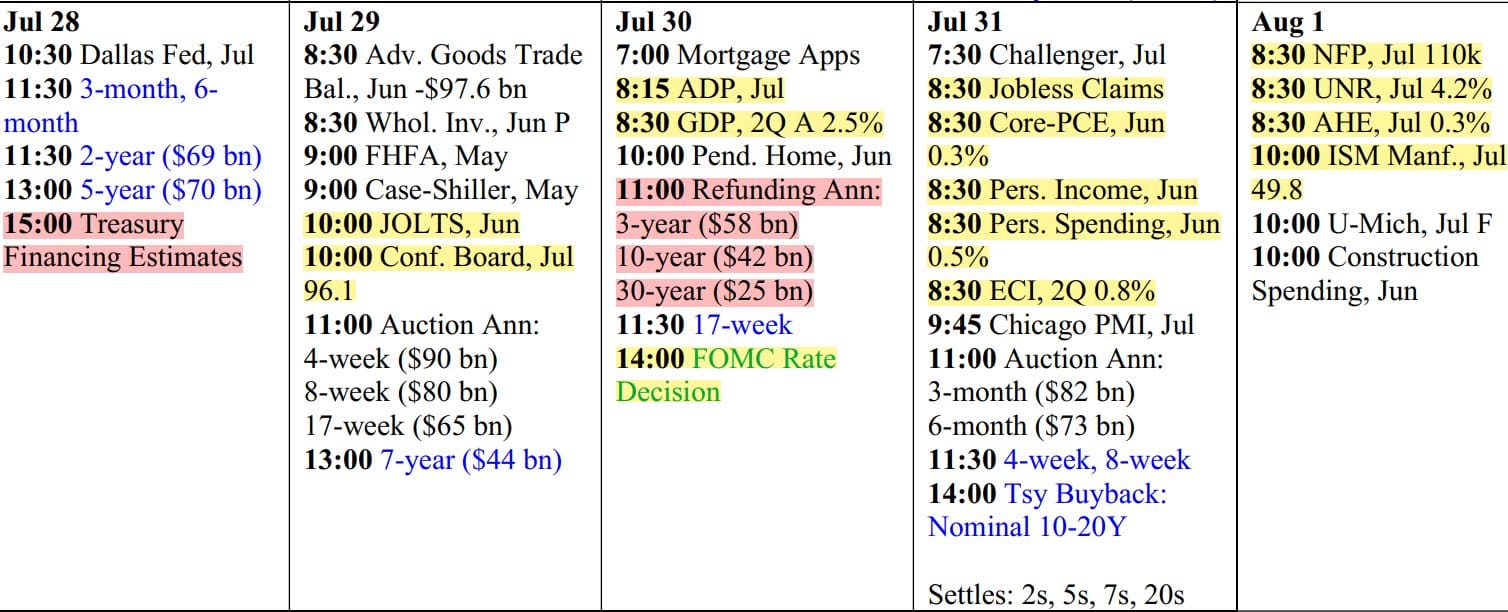
A tonne of event risks this to week to assess against the thematical views we’ve been discussing in the group. I attempt to layout some key questions and what to watch as we attempt to take the appropriate strategy views for the weeks ahead.
From a trading perspective, I think a lot of the key questions boils down to:
- will the Fed hold longer than market anticipates? and
- will the seasonal patterns play out go into the Fall?
Attempting to take a qualified view on those questions is already quite the task but first, what seasonal patterns are we talking about?
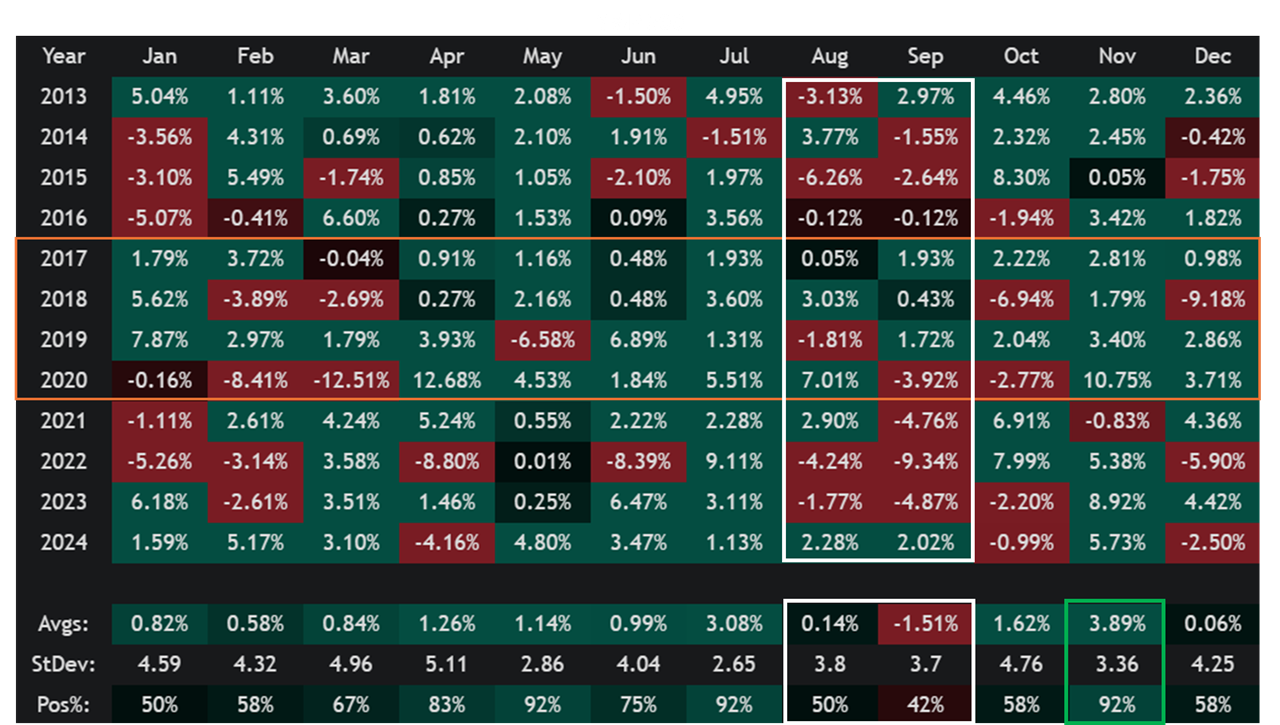
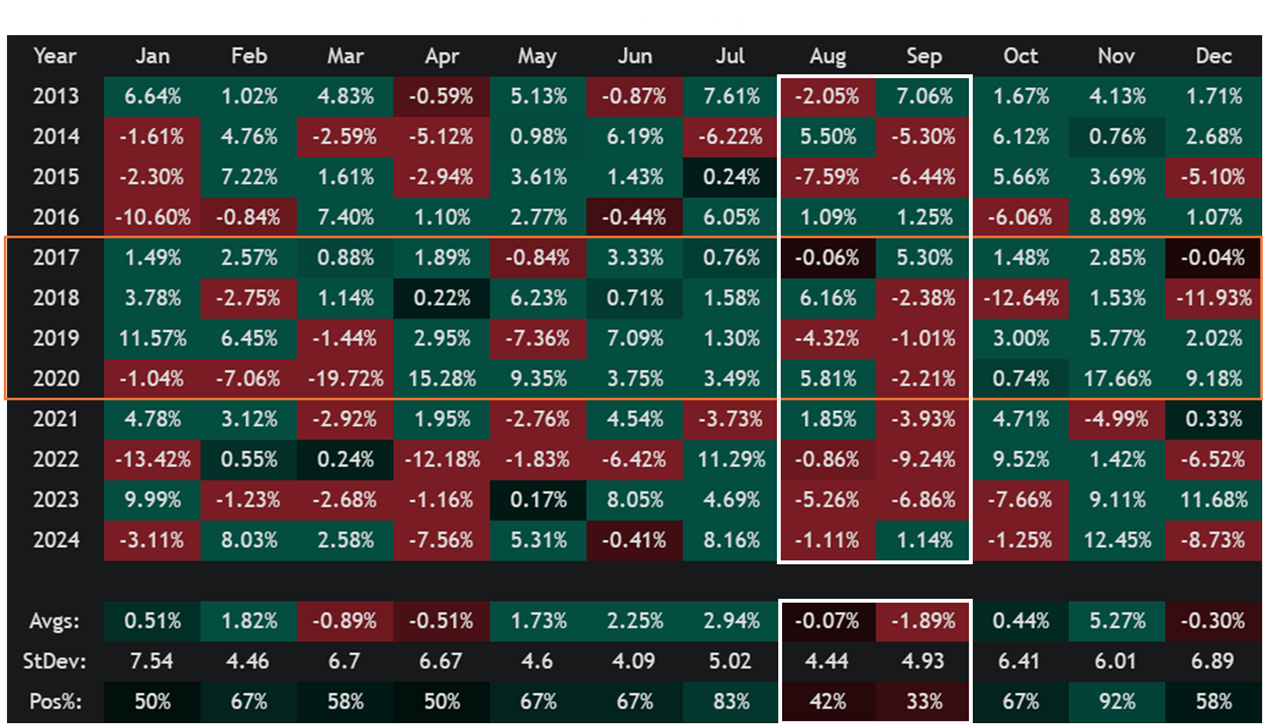
US equities enters its weakest period of the year. Even if we extend the lookback to 1990, the pattern still holds with August and September the only 2-months of the year averaging negative returns over that 35-year period.
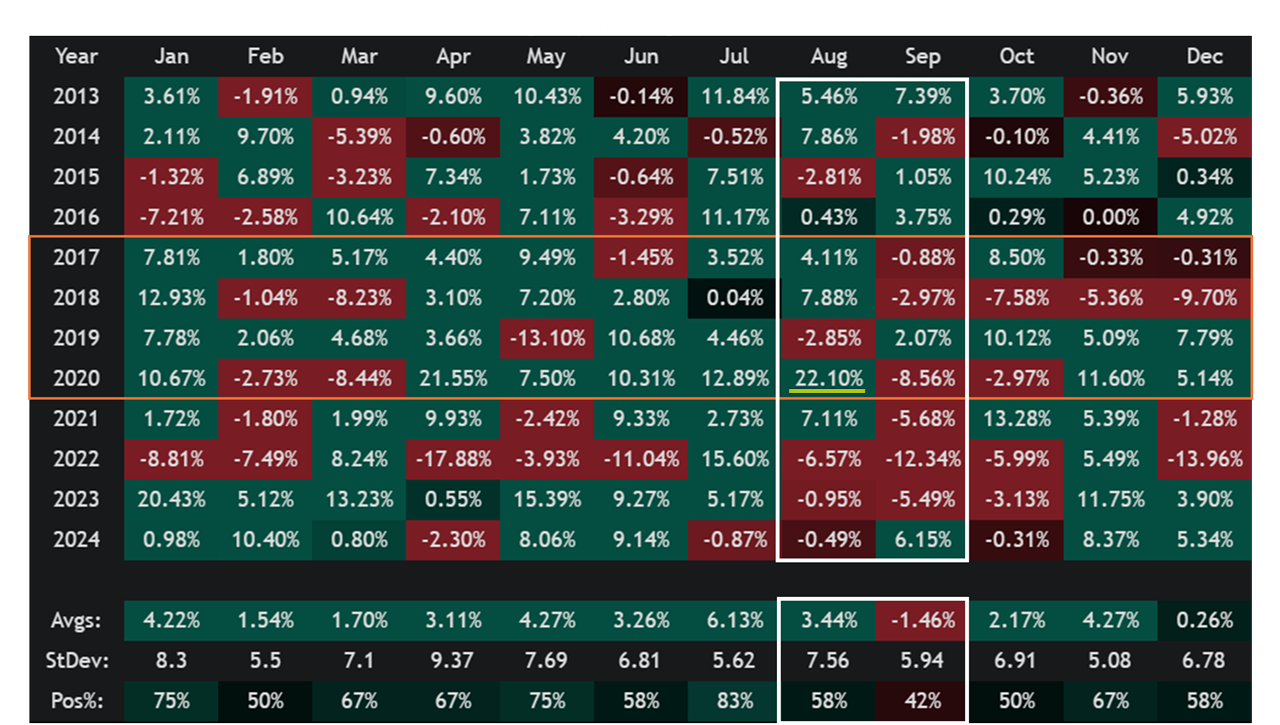
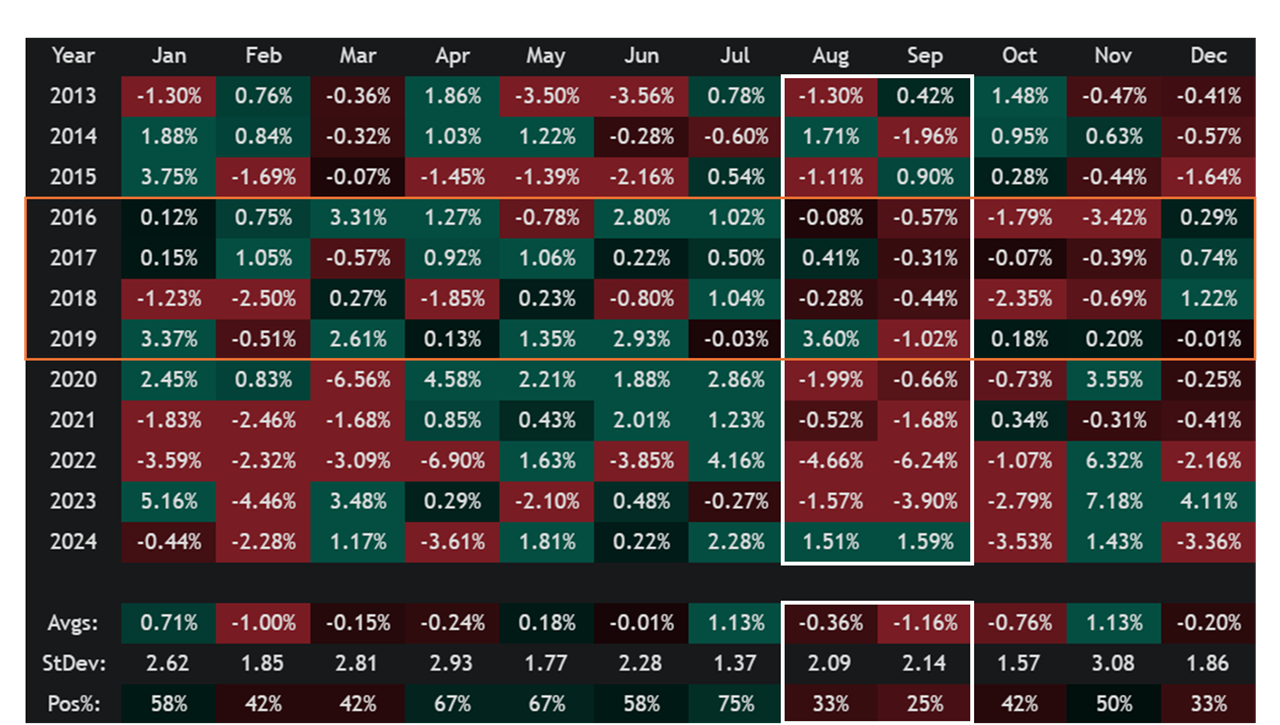
Mega-cap tech stocks have undoubtedly been the darlings of the US stock market over the last 12 years. It held up better than SPX during this period though it did have a stonking month in August of 2020 to skew the average.
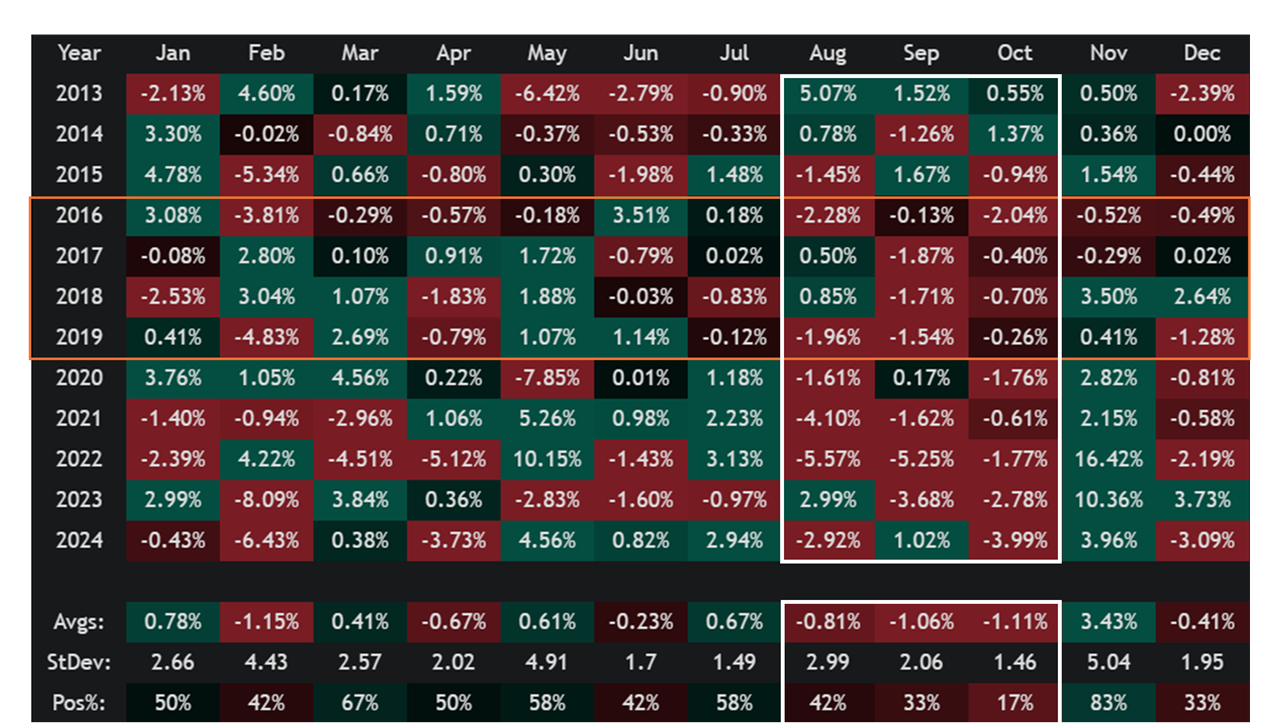
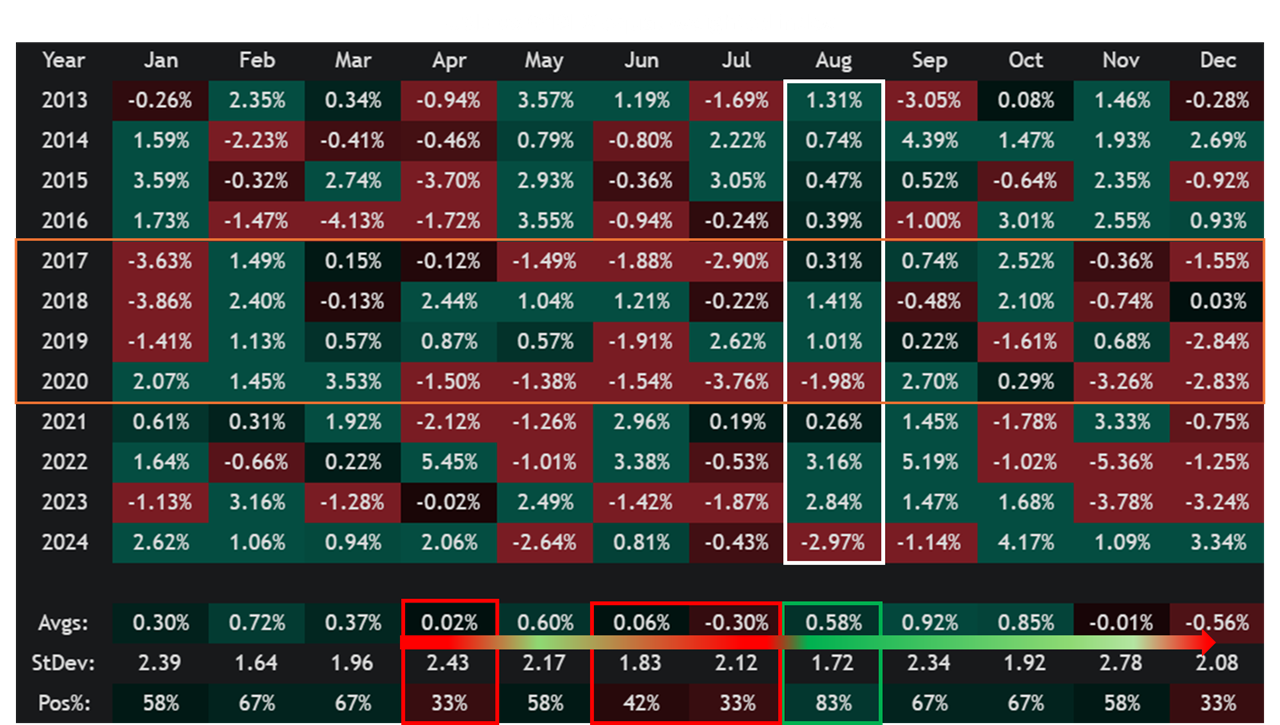
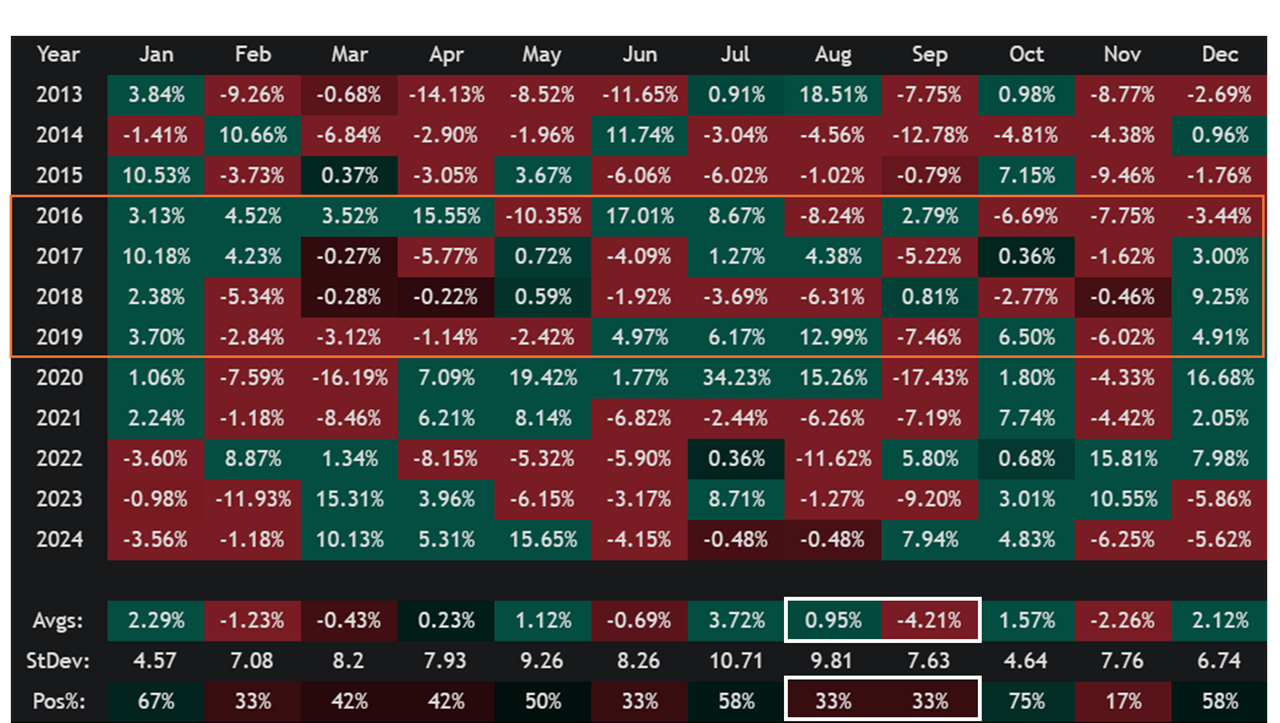
This is probably my favourite indicator for equities at the moment – low-cap Growth index as a proxy for ‘low-quality’ stocks. Just like how strong performances in low-quality stocks are an indication of how strong sentiment is, being the weakest tells us a lot about how fragile sentiment is also. After a strong 3-month seasonal stretch a lot like what we've just seen, August and September have been the weakest months, even on a lookback to year 2000.
TY interestingly has a very weak stretch into the Fall. You might look at this chart and think – ‘wait, that covers a lot of years like 2017 to 2024 where we had a bit of inflation’ but even if you take this back to the 1990s up to 2016 before Trump was first President, it stills hows a seasonally weak period for the 10-year.
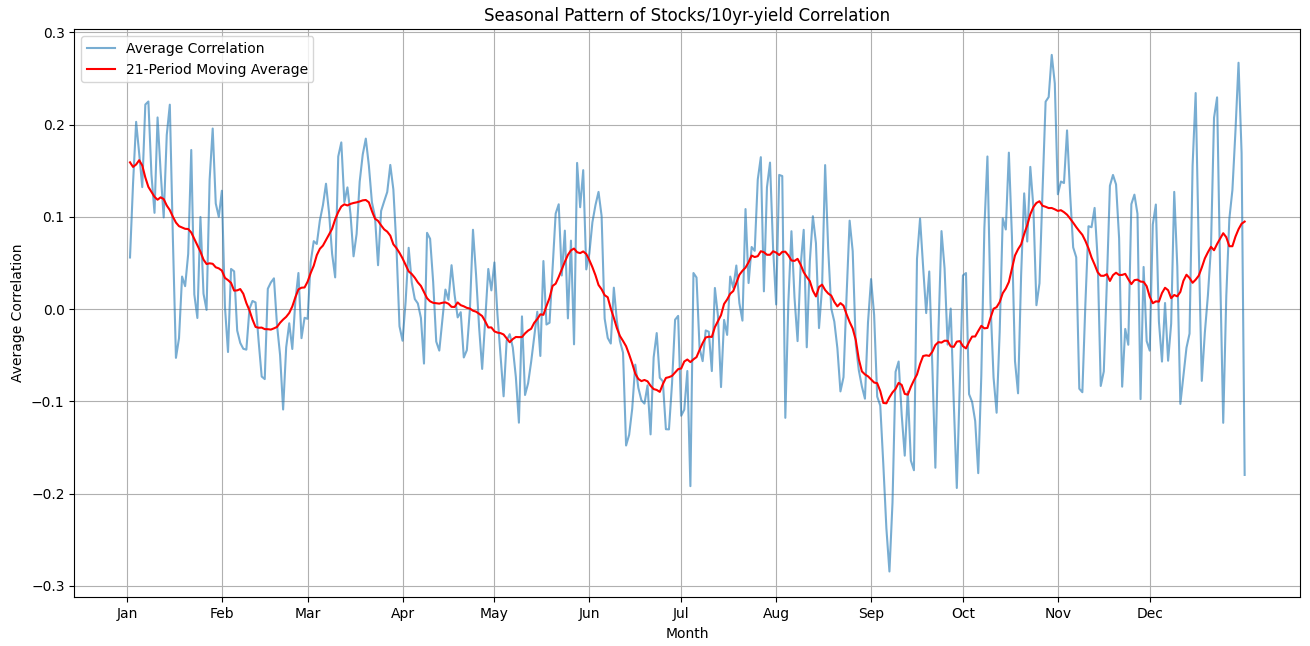
Since 1990, we have tended to see a positive stock bond correlation during August-September - I’ve used 10yr yields here so as the series moves down, stock/bond correlation goes positive and vice versa. I’ve no idea why this pattern occurs - my wild guess would be that it might be a symptom of lower liquidity summers leading to overall softness in asset prices.
Same seasonal patterns can be observed in investment grade bonds, as well as lower rated junk bonds not included here.
Dollar tends to see its strongest month of the year in August with the April to July period tending to be the weakest 4-month stretch.
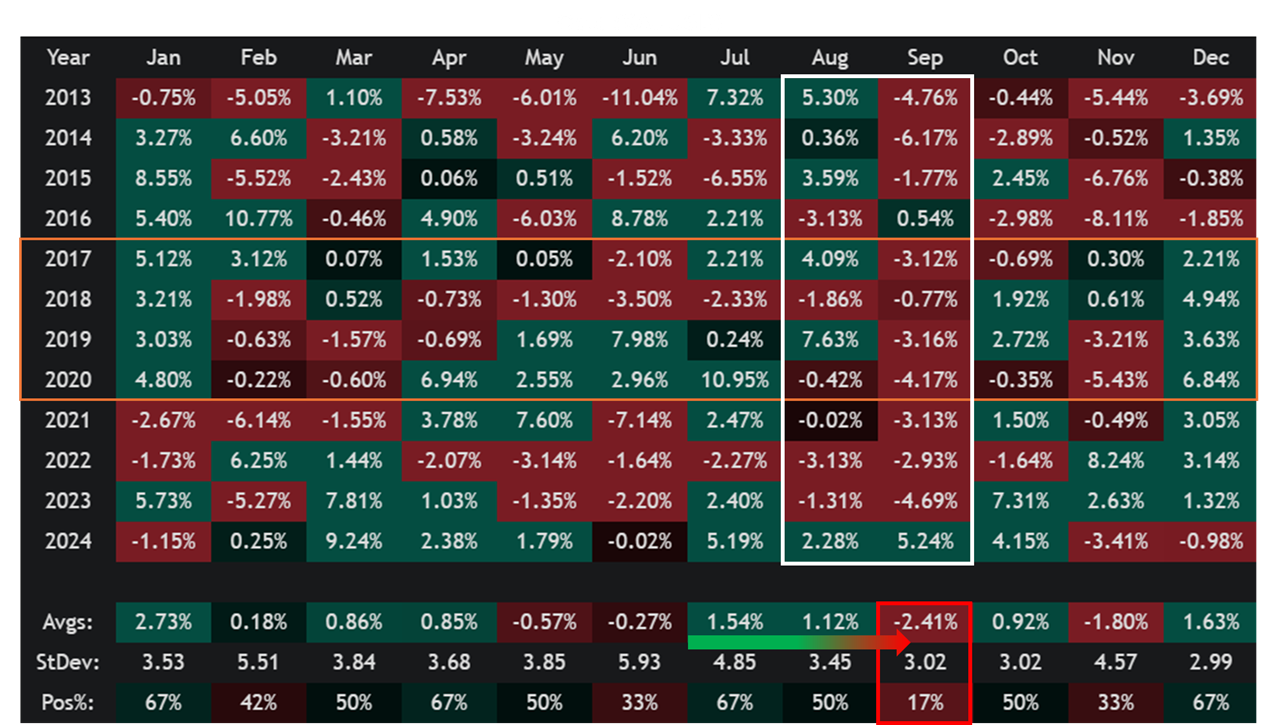
Gold has its seasonally worst month in September.
Silver too.
For whatever reason, these seasonal patterns seem to be more about rates than it is actual risk aversion. For instance, we see the Dollar bouncing back strongly in August as Bonds start to trade weak (yields higher), rate sensitive small-cap growth and corporate bonds show weakness early on, while large-caps show some resilience and later caves presumably because the yields and dollar move becomes too large to ignore.
But as the usual investment disclaimers go – past performance is not indicative of future results, and we'll assess what the chances are of those seasonals playing out by looking at various scenarios and indicators to watch below.